Power Query: Conditionally Aggregate Data From Multiple Tables
In data analysis, it is often necessary to combine or aggregate data from related tables to create meaningful insights. This article covers two methods for adding aggregated columns to a table based on filtered data from a second table.
Instructions
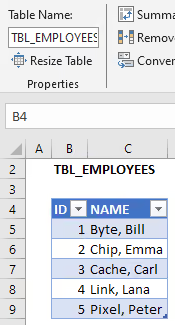
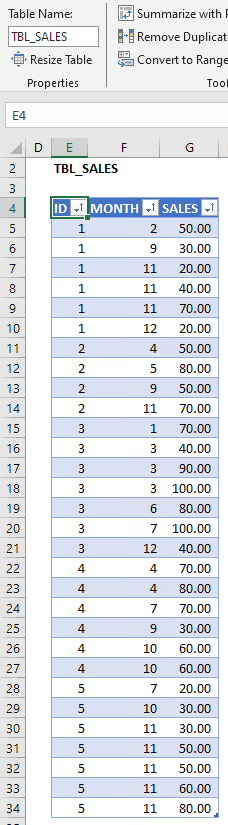
The demonstration uses two simple data tables. The first table, TBL_EMPLOYEES, contains a list of employees with their unique ID. The second table, TBL_SALES, holds the sales data for each employee by month.
Both methods import these tables in the first two query steps, naming them Source_TBL_EMPLOYEES and Source_TBL_SALES.
Method 1: Conditional Filtering and Aggregation With Table.SelectRows
This method uses Table.AddColumn, with Table.SelectRows inside each expression, to calculate the total sales and entry count.
The sales parameter represents each row from Source_TBL_SALES being filtered. The condition compares that row’s ID value (sales[ID]) with the ID value of the current row from Source_TBL_EMPLOYEES ([ID]) to find matching sales records.
This method is particularly useful for applying multiple conditions in Table.SelectRows. This example matches only on the ID column. More complex criteria (for example, matching by both ID and specific months) are easier to handle with this approach.
let
  Source_TBL_EMPLOYEES = Excel.CurrentWorkbook(){[Name = "TBL_EMPLOYEES"]}[Content],
  Source_TBL_SALES = Excel.CurrentWorkbook(){[Name = "TBL_SALES"]}[Content],
  #"Added Column - TOTAL SALES" = Table.AddColumn(
    Source_TBL_EMPLOYEES,
    "TOTAL SALES",
    each List.Sum(Table.SelectRows(Source_TBL_SALES, (sales) => sales[ID] = [ID])[SALES]),
    type number
  ),
  #"Added Column - ENTRY COUNT" = Table.AddColumn(
    #"Added Column - TOTAL SALES",
    "ENTRY COUNT",
    each Table.RowCount(Table.SelectRows(Source_TBL_SALES, (sales) => sales[ID] = [ID])),
    Int64.Type
  )
in
  #"Added Column - ENTRY COUNT"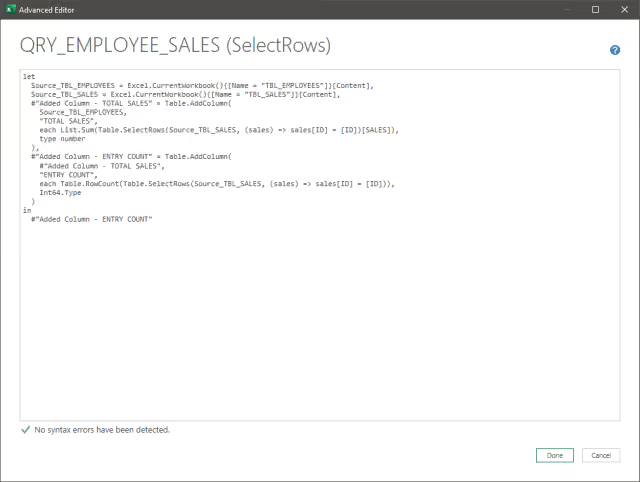
Method 2: Aggregate First, Then Merge With Table.Group and Table.NestedJoin
This method first groups Source_TBL_SALES using Table.Group to calculate the aggregates, then merges those grouped results back into Source_TBL_EMPLOYEES with Table.NestedJoin.
This method works well when the tables are joined on a single condition (in this case, the common ID column). Matching on multiple conditions is possible, but merging becomes more complex, since it often requires additional helper columns for the condition checks.
For larger datasets, the merge approach is often more efficient because the sales table is grouped once before being joined, while the filtering approach evaluates the condition for each employee row.
If an employee has no matching sales records, the expanded aggregate columns will contain null values. Replace these values with zero if required.
let
  Source_TBL_EMPLOYEES = Excel.CurrentWorkbook(){[Name = "TBL_EMPLOYEES"]}[Content],
  Source_TBL_SALES = Table.TransformColumnTypes(
    Excel.CurrentWorkbook(){[Name = "TBL_SALES"]}[Content],
    {{"MONTH", Int64.Type}, {"SALES", type number}}
  ),
  #"Merge" = Table.NestedJoin(
    Source_TBL_EMPLOYEES,
    {"ID"},
    Table.Group(
      Source_TBL_SALES,
      {"ID"},
      {
        {"TOTAL SALES", each List.Sum([SALES]), type number},
        {"ENTRY COUNT", each Table.RowCount(_), Int64.Type}
      }
    ),
    {"ID"},
    "AGGREGATED SALES",
    JoinKind.LeftOuter
  ),
  #"Expand AGGREGATED SALES" = Table.ExpandTableColumn(
    Merge,
    "AGGREGATED SALES",
    {"TOTAL SALES", "ENTRY COUNT"},
    {"TOTAL SALES", "ENTRY COUNT"}
  )
in
  #"Expand AGGREGATED SALES"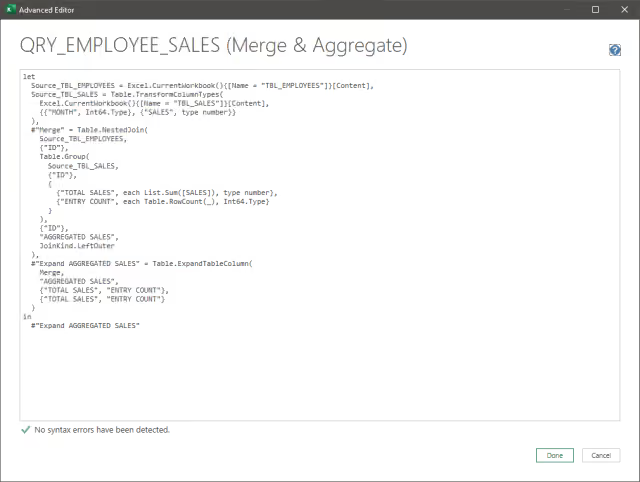
Results
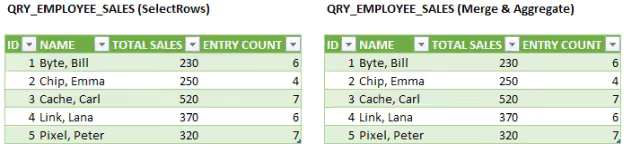
Both methods produce the same result. The tables display the correct total sales and entry count for each employee, aggregated as expected.
Summary
Both approaches enrich the data with calculated values from related tables. The first method is more flexible for complex filtering criteria, while the second method is better suited for straightforward joins and larger datasets.