Build a Power BI Progress Thermometer With Deneb and Vega
Power BI includes several ways to display progress toward a target, but a custom thermometer provides a compact alternative to standard charts and gauges. Deneb makes it possible to build this type of visual directly in Power BI using the Vega visualization grammar.
This example creates a vertical thermometer that displays a current value, a target, and the percentage of the target reached. The same visual can represent sales quotas, project completion, production goals, fundraising totals, or other measures of numeric progress.
The thermometer can display currency, quantities, or any other numeric measure. Dates, durations, and text-based statuses must first be converted into suitable numeric measures.
Data Setup
The visual uses two numeric values:
- Current Value: The amount or quantity achieved so far.
- Target: The value representing 100% completion.
The specification uses CurrentValue and Target as its default field names. The currentValueField and targetField signals can be changed to match the measure names used in a report.
The specification reads the first row of the Deneb dataset. The current value and target must therefore resolve to a single row for the intended result. A dataset containing multiple rows is not automatically aggregated by this specification.
The target should be greater than zero. A zero or negative target does not provide a meaningful scale for measuring progress.
The embedded dataset definition contains a single sample row, which allows the specification to be previewed in the Vega Editor before it is connected to Power BI. The currentValueDefault and targetDefault signals, both set to 0, apply only when the dataset contains no rows. Once the visual uses the Power BI dataset, the values come from that dataset instead.
How the Vega Specification Works
The visual combines signals, a data source, a linear scale, and graphical marks to construct the thermometer. Signals control the input fields, number formatting, dimensions, colors, and other display settings.
The complete Vega specification appears in the Source Code section at the end of this article. It can be pasted into the Deneb editor with the included sample data.
Configure the Signals
The valueFormat signal controls how numeric values are displayed. Its default format, $,.0f, displays values as whole-dollar amounts with thousands separators. Other numeric formats can be used for quantities, percentages, or values that do not represent currency. For example, ,.0f displays whole numbers with thousands separators but no currency symbol.
Color signals control the background, thermometer fill, track, outline, tick marks, and labels. Font family, text colors, label sizes, and line widths are also configurable. Changing these signals provides a straightforward way to adapt the visual to a report’s design.
Calculate Progress
The specification calculates the percentage of the target reached.
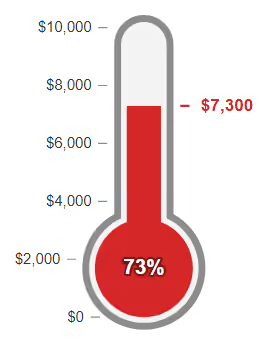
A current value of 7,300 against a target of 10,000 produces a progress value of 0.73, or 73%.
The calculation is constrained to the range from zero to one. This keeps the thermometer fill within its track when the current value is negative or exceeds the target. When the current value is greater than the target, the fill remains at 100%, while the numeric value label can still show the actual current value.
Build the Scale and Tick Marks
A linear scale maps the numeric target range to positions along the thermometer. Tick marks and labels provide reference points so the fill can be interpreted without relying solely on the percentage label.
The tickCount signal controls the number of intervals on the scale. With the default value of five, the scale displays six tick marks, including the endpoints at zero and the target.
Draw the Thermometer
The thermometer is constructed from several Vega marks:
- Wall: Defines the outer shape of the tube and the bulb.
- Track: Provides the background for the progress fill in the tube and the bulb.
- Fill: Shows the proportion of the target reached, clipped at the current level.
- Tick marks and labels: Show reference values along the scale.
- Current value marker and label: Identify the current result.
- Percentage label: Displays the calculated progress inside the bulb.
The scale starts at the bottom of the bulb, so the bulb fills first. At the default dimensions, the fill reaches the top of the bulb at roughly 20 percent of the target, then continues up the tube.
The fill uses red in the supplied specification, while the track and wall use gray tones.
Adjust the Layout
The containerWidth and containerHeight signals control the overall size, and the example uses 300 by 500 pixels. The tube height and horizontal position are calculated from these signals, but values such as tubeWidth, bulbRadius, and the gutters remain fixed. If the visual is much narrower than the 300 pixel default, adjust those values.
Connect the Visual to Power BI
After testing the specification with its sample data, connect it to the report’s measures. This example was built with Deneb 2.0.0 using Vega 6.
- Add the Deneb visual to the report.
- Select
Vegaas the visualization language. - Add
CurrentValueandTargettoValues.
Deneb exposes each data field to Vega by the name shown in the Values field well, so the names must match the specification. If the model columns use different names, rename the fields in the Values field well or set the currentValueField and targetField signals to those names.
- Add the Vega specification.
- Replace the embedded
datasetdefinition, including the sample values, with the definition shown below.
{ "name": "dataset" }- Optionally, connect the size of the thermometer to the size of the Power BI visual by replacing the
containerWidthandcontainerHeightsignals with the following definitions:
{ "name": "containerWidth", "update": "denebContainer.width - 10" },
{ "name": "containerHeight", "update": "denebContainer.height - 10" }
The denebContainer.width and denebContainer.height values report the size of the Power BI visual. The subtraction leaves a small margin around the thermometer. If scrollbars appear, increase the amount subtracted. These values are provided by Deneb, so the fixed dimensions remain useful when testing the specification elsewhere, such as the Vega Editor.
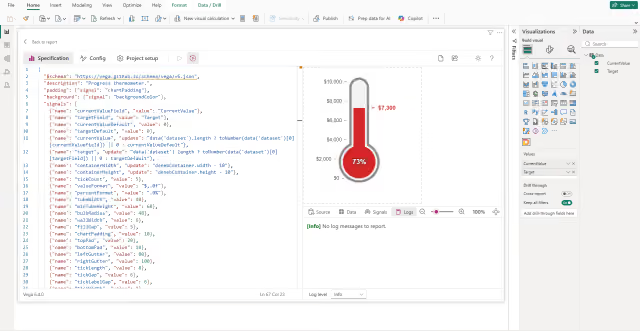
- Apply the specification and confirm that the thermometer displays the expected value, target, and percentage.
Results
The completed visual provides a compact view of progress toward a numeric target. It displays the current value, target scale, and percentage reached in a thermometer layout.
The result should have the following characteristics:
- The bulb and the tube are both empty when the current value is zero.
- The fill rises through the bulb first, and then through the tube.
- The scale shows reference amounts from zero to the target.
- A marker and label follow the top of the fill and stay clear of the bulb.
- The percentage in the bulb remains readable at any fill level.
- A current value above the target fills the thermometer completely, and the value label continues to show the actual amount.
- The thermometer and its labels are centered horizontally in the visual. The thermometer’s size follows the Power BI visual when the optional container step is applied.
The same visual can be reused for different measures by changing the field names, formatting, and appearance.
Troubleshooting
The following are common issues when connecting the specification to a report.
- When the thermometer is empty and displays 0%, the
currentValueFieldortargetFieldsignal likely does not match a name shown in theValuesfield well. The specification treats a missing value as zero and does not display an error, so set both signals to the exact field names. If the names already match, a blank target also produces 0%, so check the scale as described next. - When the scale labels and tick marks overlap or display only zero amounts, the target is likely blank, zero, or negative. The specification does not support these targets, and the percentage remains at 0%. Confirm that the target measure returns a positive value for the filters applied to the visual.
- When the values do not match the expected result, the dataset likely contains more than one row. The specification reads only the first row, and an additional field in
Values, such as a category, produces multiple rows. Remove the extra field or filter the visual to a single row. - When the thermometer is clipped or scrollbars appear, the fixed default size likely does not match the visual. Apply the optional container size step in the Connect the Visual to Power BI section, and increase the amount subtracted if scrollbars remain.
- When the scale labels crowd together, the visual is too short for six labels. Reduce the
tickCountsignal.
Source Code
{
  "$schema": "https://vega.github.io/schema/vega/v6.json",
  "description": "Progress thermometer.",
  "padding": { "signal": "chartPadding" },
  "background": { "signal": "backgroundColor" },
  "signals": [
    { "name": "currentValueField", "value": "CurrentValue" },
    { "name": "targetField", "value": "Target" },
    { "name": "currentValueDefault", "value": 0 },
    { "name": "targetDefault", "value": 0 },
    { "name": "currentValue", "update": "data('dataset').length ? toNumber(data('dataset')[0][currentValueField]) || 0 : currentValueDefault" },
    { "name": "target", "update": "data('dataset').length ? toNumber(data('dataset')[0][targetField]) || 0 : targetDefault" },
    { "name": "containerWidth", "value": 300 },
    { "name": "containerHeight", "value": 500 },
    { "name": "tickCount", "value": 5 },
    { "name": "valueFormat", "value": "$,.0f" },
    { "name": "percentFormat", "value": ".0%" },
    { "name": "tubeWidth", "value": 40 },
    { "name": "minTubeHeight", "value": 60 },
    { "name": "bulbRadius", "value": 48 },
    { "name": "wallWidth", "value": 6 },
    { "name": "fillGap", "value": 5 },
    { "name": "chartPadding", "value": 10 },
    { "name": "topPad", "value": 20 },
    { "name": "bottomPad", "value": 10 },
    { "name": "leftGutter", "value": 80 },
    { "name": "rightGutter", "value": 100 },
    { "name": "tickLength", "value": 8 },
    { "name": "tickGap", "value": 6 },
    { "name": "tickLabelGap", "value": 6 },
    { "name": "tickWidth", "value": 1 },
    { "name": "markerWidth", "value": 2 },
    { "name": "markerGap", "value": 10 },
    { "name": "backgroundColor", "value": "#ffffff" },
    { "name": "fillColor", "value": "#d62728" },
    { "name": "trackColor", "value": "#f3f3f3" },
    { "name": "wallColor", "value": "#8c8c8c" },
    { "name": "tickColor", "value": "#8c8c8c" },
    { "name": "markerColor", "value": "#d62728" },
    { "name": "textColor", "value": "#333333" },
    { "name": "bulbTextColor", "value": "#ffffff" },
    { "name": "bulbTextHaloColor", "value": "#7a1415" },
    { "name": "fontFamily", "value": "sans-serif" },
    { "name": "fontSize", "value": 13 },
    { "name": "levelFontSize", "value": 15 },
    { "name": "bulbFontSize", "value": 18 },
    { "name": "labelFontWeight", "value": "bold" },
    { "name": "bulbTextHaloWidth", "value": 4 },
    { "name": "pct", "update": "target > 0 ? clamp(currentValue / target, 0, 1) : 0" },
    { "name": "width", "update": "containerWidth - 2 * chartPadding" },
    { "name": "height", "update": "containerHeight - 2 * chartPadding" },
    { "name": "contentWidth", "update": "leftGutter + 2 * (bulbRadius + wallWidth) + rightGutter" },
    { "name": "cx", "update": "max(0, (width - contentWidth) / 2) + leftGutter + wallWidth + bulbRadius" },
    { "name": "tubeHeight", "update": "max(minTubeHeight, height - topPad - bulbRadius - wallWidth - bottomPad)" },
    { "name": "bulbCy", "update": "topPad + tubeHeight" },
    { "name": "tubeLeft", "update": "cx - tubeWidth / 2" },
    { "name": "tubeRight", "update": "cx + tubeWidth / 2" },
    { "name": "fillWidth", "update": "tubeWidth - 2 * fillGap" },
    { "name": "scaleTop", "update": "topPad + fillGap" },
    { "name": "scaleBottom", "update": "bulbCy + bulbRadius - fillGap" },
    { "name": "level", "update": "scaleBottom - pct * (scaleBottom - scaleTop)" },
    { "name": "fillTopRadius", "update": "pct >= 1 ? fillWidth / 2 : 0" },
    { "name": "levelEdge", "update": "abs(level - bulbCy) < bulbRadius + wallWidth ? cx + sqrt(pow(bulbRadius + wallWidth, 2) - pow(level - bulbCy, 2)) : 0" },
    { "name": "markerX", "update": "max(tubeRight + wallWidth, levelEdge) + tickGap" }
  ],
  "data": [
    { "name": "dataset", "values": [{ "CurrentValue": 7300, "Target": 10000 }] },
    {
      "name": "ticks",
      "transform": [
        { "type": "sequence", "start": 0, "stop": { "signal": "tickCount + 1" }, "step": 1 },
        { "type": "formula", "as": "value", "expr": "datum.data * target / tickCount" }
      ]
    }
  ],
  "scales": [
    {
      "name": "y",
      "type": "linear",
      "domain": [0, { "signal": "target" }],
      "range": [{ "signal": "scaleBottom" }, { "signal": "scaleTop" }]
    }
  ],
  "marks": [
    {
      "type": "rect",
      "name": "wallTube",
      "encode": {
        "update": {
          "x": { "signal": "tubeLeft - wallWidth" },
          "x2": { "signal": "tubeRight + wallWidth" },
          "y": { "signal": "topPad - wallWidth" },
          "y2": { "signal": "bulbCy" },
          "cornerRadiusTopLeft": { "signal": "tubeWidth / 2 + wallWidth" },
          "cornerRadiusTopRight": { "signal": "tubeWidth / 2 + wallWidth" },
          "fill": { "signal": "wallColor" }
        }
      }
    },
    {
      "type": "symbol",
      "name": "wallBulb",
      "encode": {
        "update": {
          "shape": { "value": "circle" },
          "x": { "signal": "cx" },
          "y": { "signal": "bulbCy" },
          "size": { "signal": "pow(2 * (bulbRadius + wallWidth), 2)" },
          "fill": { "signal": "wallColor" }
        }
      }
    },
    {
      "type": "rect",
      "name": "trackTube",
      "encode": {
        "update": {
          "x": { "signal": "tubeLeft" },
          "x2": { "signal": "tubeRight" },
          "y": { "signal": "topPad" },
          "y2": { "signal": "bulbCy" },
          "cornerRadiusTopLeft": { "signal": "tubeWidth / 2" },
          "cornerRadiusTopRight": { "signal": "tubeWidth / 2" },
          "fill": { "signal": "trackColor" }
        }
      }
    },
    {
      "type": "symbol",
      "name": "trackBulb",
      "encode": {
        "update": {
          "shape": { "value": "circle" },
          "x": { "signal": "cx" },
          "y": { "signal": "bulbCy" },
          "size": { "signal": "pow(2 * bulbRadius, 2)" },
          "fill": { "signal": "trackColor" }
        }
      }
    },
    {
      "type": "group",
      "name": "fillGroup",
      "encode": {
        "update": {
          "width": { "signal": "width" },
          "y": { "signal": "level" },
          "height": { "signal": "height - level" },
          "clip": { "value": true }
        }
      },
      "marks": [
        {
          "type": "rect",
          "name": "fillTube",
          "encode": {
            "update": {
              "x": { "signal": "tubeLeft + fillGap" },
              "x2": { "signal": "tubeRight - fillGap" },
              "y": { "value": 0 },
              "y2": { "signal": "bulbCy - level" },
              "cornerRadiusTopLeft": { "signal": "fillTopRadius" },
              "cornerRadiusTopRight": { "signal": "fillTopRadius" },
              "fill": { "signal": "fillColor" }
            }
          }
        },
        {
          "type": "symbol",
          "name": "fillBulb",
          "encode": {
            "update": {
              "shape": { "value": "circle" },
              "x": { "signal": "cx" },
              "y": { "signal": "bulbCy - level" },
              "size": { "signal": "pow(2 * (bulbRadius - fillGap), 2)" },
              "fill": { "signal": "fillColor" }
            }
          }
        }
      ]
    },
    {
      "type": "text",
      "name": "percentLabelHalo",
      "encode": {
        "update": {
          "x": { "signal": "cx" },
          "y": { "signal": "bulbCy" },
          "text": { "signal": "format(pct, percentFormat)" },
          "align": { "value": "center" },
          "baseline": { "value": "middle" },
          "fontWeight": { "signal": "labelFontWeight" },
          "font": { "signal": "fontFamily" },
          "fontSize": { "signal": "bulbFontSize" },
          "fill": { "signal": "bulbTextHaloColor" },
          "stroke": { "signal": "bulbTextHaloColor" },
          "strokeWidth": { "signal": "bulbTextHaloWidth" },
          "strokeJoin": { "value": "round" }
        }
      }
    },
    {
      "type": "text",
      "name": "percentLabel",
      "encode": {
        "update": {
          "x": { "signal": "cx" },
          "y": { "signal": "bulbCy" },
          "text": { "signal": "format(pct, percentFormat)" },
          "align": { "value": "center" },
          "baseline": { "value": "middle" },
          "fontWeight": { "signal": "labelFontWeight" },
          "font": { "signal": "fontFamily" },
          "fontSize": { "signal": "bulbFontSize" },
          "fill": { "signal": "bulbTextColor" }
        }
      }
    },
    {
      "type": "rule",
      "name": "tickMarks",
      "from": { "data": "ticks" },
      "encode": {
        "update": {
          "x": { "signal": "abs(scale('y', datum.value) - bulbCy) < bulbRadius + wallWidth ? cx - sqrt(pow(bulbRadius + wallWidth, 2) - pow(scale('y', datum.value) - bulbCy, 2)) - tickGap - tickLength : tubeLeft - wallWidth - tickGap - tickLength" },
          "x2": { "signal": "abs(scale('y', datum.value) - bulbCy) < bulbRadius + wallWidth ? cx - sqrt(pow(bulbRadius + wallWidth, 2) - pow(scale('y', datum.value) - bulbCy, 2)) - tickGap : tubeLeft - wallWidth - tickGap" },
          "y": { "scale": "y", "field": "value" },
          "stroke": { "signal": "tickColor" },
          "strokeWidth": { "signal": "tickWidth" }
        }
      }
    },
    {
      "type": "text",
      "name": "tickLabels",
      "from": { "data": "ticks" },
      "encode": {
        "update": {
          "x": { "signal": "abs(scale('y', datum.value) - bulbCy) < bulbRadius + wallWidth ? cx - sqrt(pow(bulbRadius + wallWidth, 2) - pow(scale('y', datum.value) - bulbCy, 2)) - tickGap - tickLength - tickLabelGap : tubeLeft - wallWidth - tickGap - tickLength - tickLabelGap" },
          "y": { "scale": "y", "field": "value" },
          "text": { "signal": "format(datum.value, valueFormat)" },
          "align": { "value": "right" },
          "baseline": { "value": "middle" },
          "font": { "signal": "fontFamily" },
          "fontSize": { "signal": "fontSize" },
          "fill": { "signal": "textColor" }
        }
      }
    },
    {
      "type": "rule",
      "name": "levelMarker",
      "encode": {
        "update": {
          "x": { "signal": "markerX" },
          "x2": { "signal": "markerX + tickLength" },
          "y": { "signal": "level" },
          "stroke": { "signal": "markerColor" },
          "strokeWidth": { "signal": "markerWidth" }
        }
      }
    },
    {
      "type": "text",
      "name": "levelLabel",
      "encode": {
        "update": {
          "x": { "signal": "markerX + tickLength + markerGap" },
          "y": { "signal": "level" },
          "text": { "signal": "format(currentValue, valueFormat)" },
          "baseline": { "value": "middle" },
          "fontWeight": { "signal": "labelFontWeight" },
          "font": { "signal": "fontFamily" },
          "fontSize": { "signal": "levelFontSize" },
          "fill": { "signal": "markerColor" }
        }
      }
    }
  ]
}
Summary
Deneb and Vega make it possible to build a custom progress thermometer for Power BI without a dedicated custom visual. The specification combines a numeric scale, calculated progress, and graphical marks to display a current value against a target.
The visual can be adapted to different numeric measures by changing the field names, number formatting, colors, and dimensions. Its single-row data requirement and numeric-value limitation should be considered when connecting it to a report.