Power BI Slicer for Multi-Value Columns: Splitting Delimited Data for Better Filtering
This article demonstrates creating a Slicer based on a data column containing multiple entries separated by a delimiter. The goal is for the Slicer to display each entry as an individual item, allowing users to filter data without selecting each grouped entry manually.
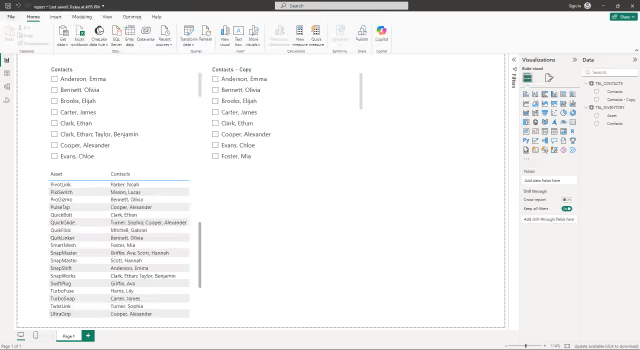
As an example, the sample data is an asset inventory with each asset owned by one or more named individuals. In instances where an asset is owned by multiple individuals, their names are delimited by a semicolon. An individual may be an owner of one or more assets.
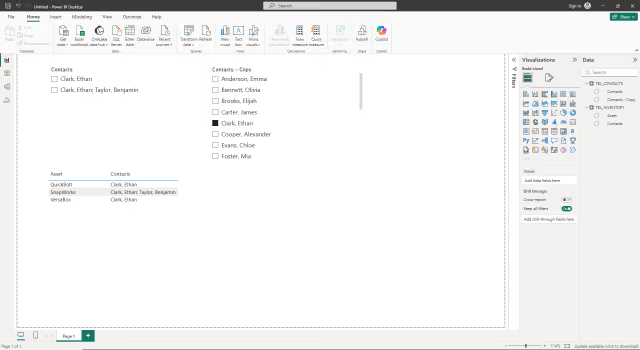
In the sample data, the individual named “Clark, Ethan” is listed as the singular owner of the assets named “QuickBolt” and “VersaBox” and the co-owner, with “Taylor, Benjamin”, of the asset named “SnapWorks”. If a Slicer is added using the Contacts field in the sample data, both entries for “Clark, Ethan” and “Clark, Ethan; Taylor, Benjamin” need to be selected to find all assets owned by “Clark, Ethan”. The goal of this exercise is to create a Slicer allowing the user to select “Clark, Ethan” to display all of that owner’s assets regardless of co-ownership.
This approach leaves the original inventory table unchanged. Only a helper table is created for Slicer purposes.
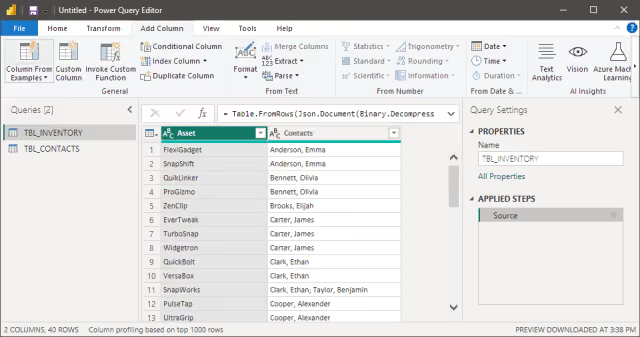
For this exercise, the source data is in a table named TBL_INVENTORY, with two columns: Asset and Contacts.
Prepare the Slicer Data
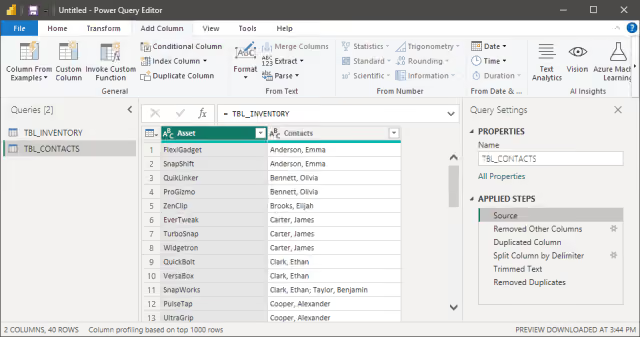
A new table with individual entries is required for the Slicer. The query below splits grouped entries using a delimiter. For reference, the full query is provided with step-by-step explanations. Both the query and the resulting table are named TBL_CONTACTS.
let
  Source = TBL_INVENTORY,
  #"Removed Other Columns" = Table.SelectColumns(Source, {"Contacts"}),
  #"Duplicated Column" = Table.DuplicateColumn(
    #"Removed Other Columns",
    "Contacts",
    "Contacts - Copy"
  ),
  #"Split Column by Delimiter" = Table.ExpandListColumn(
    Table.TransformColumns(
      #"Duplicated Column",
      {
        {
          "Contacts - Copy",
          Splitter.SplitTextByDelimiter(";", QuoteStyle.Csv),
          let
            itemType = (type nullable text) meta [Serialized.Text = true]
          in
            type {itemType}
        }
      }
    ),
    "Contacts - Copy"
  ),
  #"Trimmed Text" = Table.TransformColumns(
    #"Split Column by Delimiter",
    {{"Contacts - Copy", Text.Trim, type text}}
  ),
  #"Removed Duplicates" = Table.Distinct(#"Trimmed Text")
in
  #"Removed Duplicates"
Source Data
The process starts by creating a blank query:
- From the
Hometab in Power BI, clickGet dataand selectBlank query. - The Power Query window is displayed.
- Set the initial data source by entering
= TBL_INVENTORYin the command field.
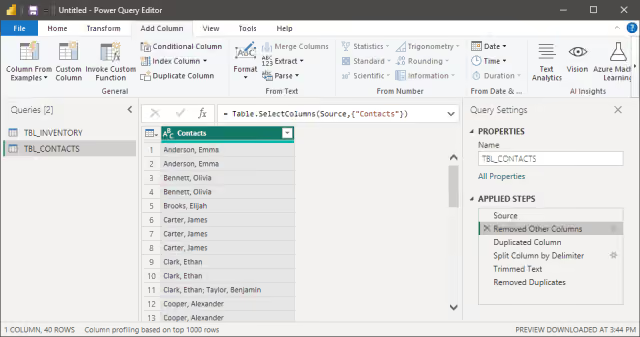
Remove Other Columns
Next, keep only the Contacts column:
- Highlight the
Contactscolumn. - From the
Hometab, clickRemove Columnsand selectRemove Other Columns.
Duplicate Column
At this stage, only the Contacts column remains.
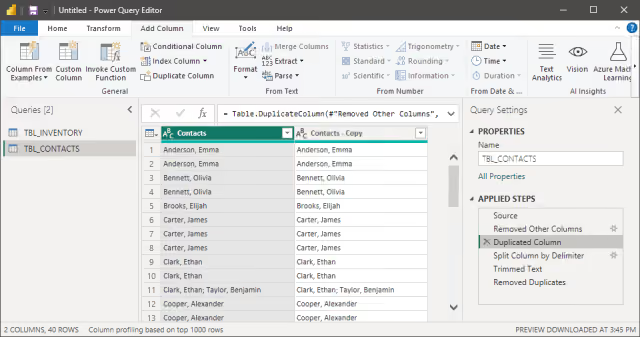
- From the
Add Columntab, clickDuplicate Column. - The table now has two columns labeled
ContactsandContacts - Copy.
The duplicate preserves the original delimited values needed for the relationship while allowing the copy to be split into individual rows.
Split Column
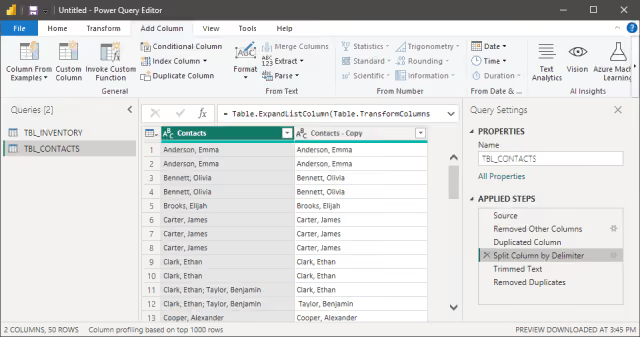
- Highlight the
Contacts - Copycolumn. - From the
Transformtab, clickSplit Columnand selectBy Delimiter. - The
Split Column by Delimiterdialog box is displayed.
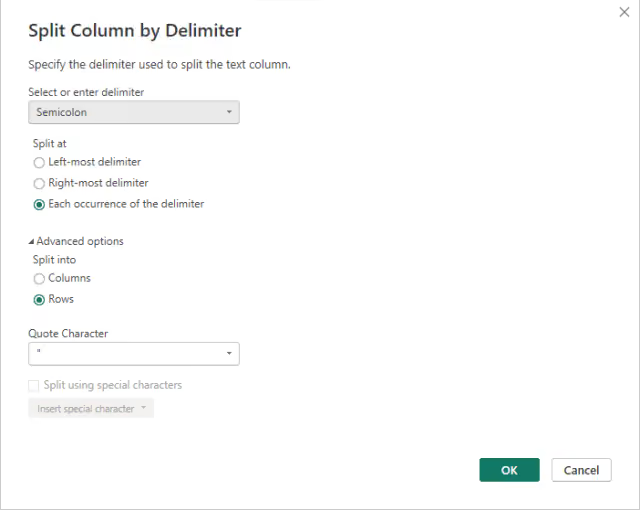
- In the sample data, the delimiter is a semicolon. In the
Select or enter delimiter, selectSemicolon. - For the
Split atdropdown, selectEach occurrence of the delimiter. - Expand the
Advanced options. - Under
Split into, selectRows. - Click the
OKbutton.
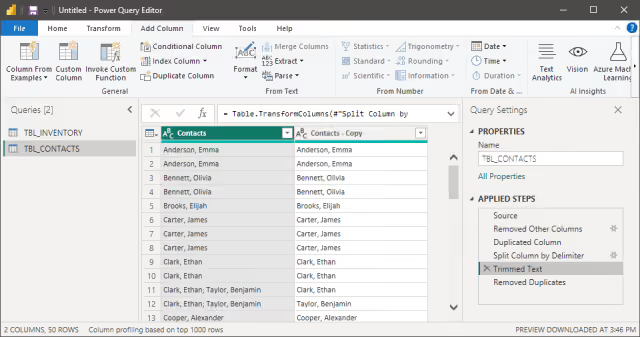
Trim Text
- Highlight the
Contacts - Copycolumn. - From the
Add Columntab, clickFormatand selectTrim.
Trimming removes spaces that often appear after delimiters, preventing duplicate-looking entries like “Clark, Ethan” and “ Clark, Ethan”.
Remove Duplicates
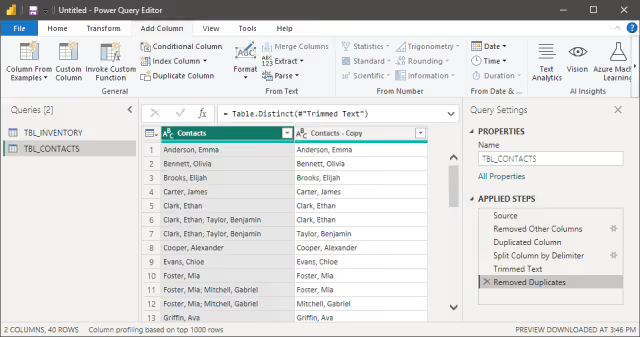
From the Home tab, select Remove Rows and click Remove Duplicates.
Removing duplicates ensures each contact appears only once in the Slicer.
Relating Tables
Once the helper table has been prepared, the next step is establishing the relationship between the two tables.
The original Contacts column is retained in TBL_CONTACTS to serve as the relationship key, matching the grouped values in TBL_INVENTORY. The Contacts - Copy column holds the individual split names and supplies the values for the Slicer.
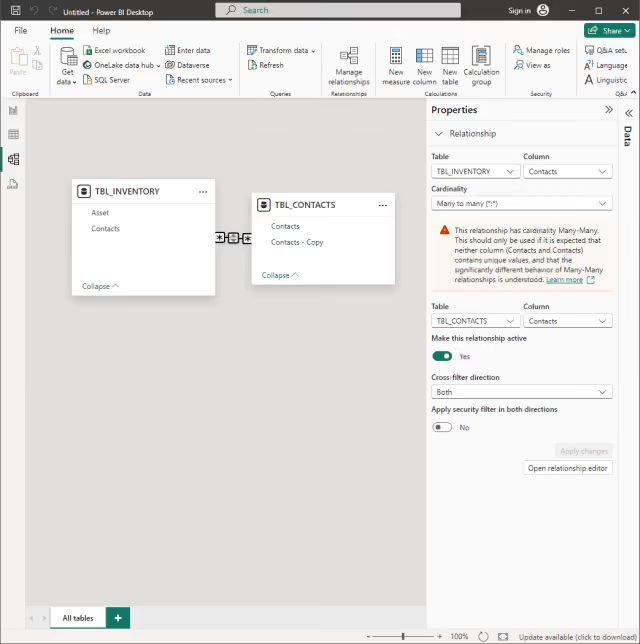
- In Power BI, switch to the
Model view. - Create a relationship between
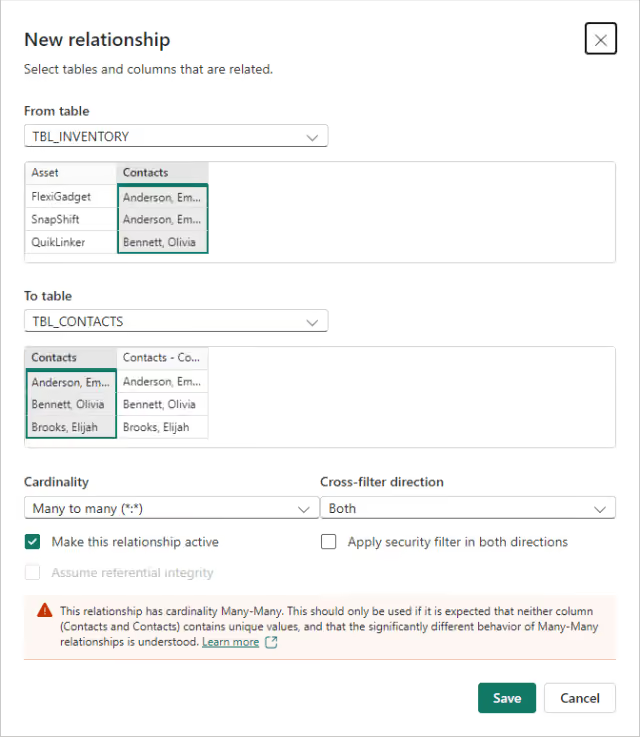
TBL_INVENTORYandTBL_CONTACTSby dragging theContactsfield inTBL_INVENTORYto theContactsfield inTBL_CONTACTS. - The
New relationshipdialog box is displayed. - Set the
CardinalitytoMany to many (*:*)withCross-filter directionset toBoth. - Enable the
Make this relationship activecheckbox. - Click the
Savebutton.
Although many-to-many relationships are generally avoided in dimensional models, this scenario requires one. Splitting Contacts - Copy into rows duplicates the original Contacts value once per co-owner, so Contacts is no longer unique in TBL_CONTACTS, which rules out a standard one-to-many relationship.
Add Visualizations and Slicers
Finally, add a Table visualization and Slicer:
- In Power BI, switch to
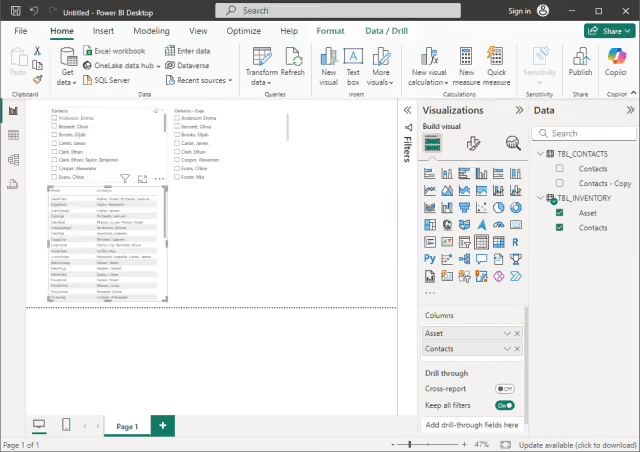
Report view. - Add a
Tablevisualization. - From
TBL_INVENTORY, configure the Table visualization by addingAssetandContactstoColumns.
- Add a
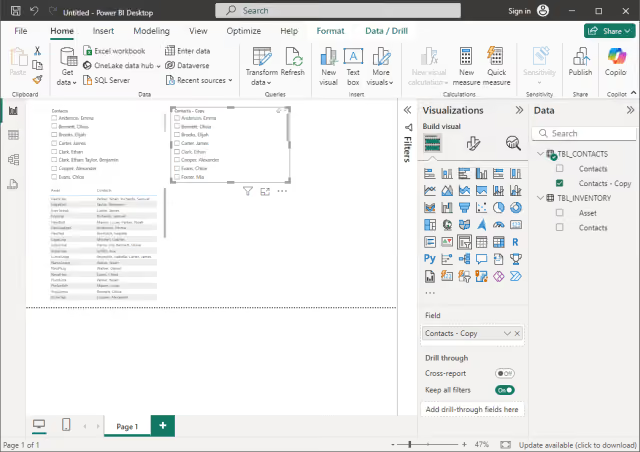
Slicer. - From
TBL_CONTACTS, configure the Slicer by addingContacts - CopytoField.
Results
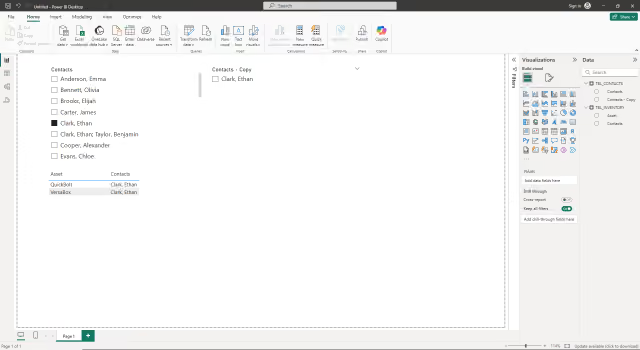
In the screenshot below, the Slicer on the right is based on individual contact names. Selecting “Clark, Ethan” filters the Table correctly, displaying all entries associated with him, including those where he is a co-owner.
Summary
This article demonstrated creating a Slicer based on a delimited data column, allowing users to filter individual contact names easily. Preparing the Slicer data and relating the tables ensures that selecting a name in the Slicer displays all relevant assets, even those with co-ownership.