Power BI Map Visualizations: Mapping Common City Names
Working with geographic data is complicated. Some challenges include disputed land areas, countries that are not recognized by others, and the lack of an international standard for address formats.
This makes using the Power BI Map and Filled Map visualizations challenging. The complexity only increases at further levels of granularity. Unlike continent-level and country-level data, city-level data contains many locations with the same name. To ensure that Power BI renders a Map visualization correctly, additional supporting data points must be provided to the Bing/Azure mapping service so that the correct location is identified on the Map. The examples below use the Map visualization, though the same location-resolution logic likely applies to Filled Map since both rely on the same underlying geocoding service.
This happens because the mapping service performs a best-effort lookup against a geographic database, and an ambiguous place name requires it to select the most likely matching location. The same issue applies to any commonly reused name, not just Newark, so cities like Springfield, Franklin, or Georgetown face the identical problem.
The more geographic context provided to the mapping service, the less ambiguity remains when resolving place names.

Commonly Named Cities
To demonstrate city-level mapping complexity in Power BI, the city of Newark is used in the following examples. Newark is one of the oldest cities in the United States and the most populous city in New Jersey, but that is not why it was chosen. Newark is complex from a mapping perspective because there are many cities and towns with that name: at least 16 in the United States and at least two in the United Kingdom.
The following table represents the data used in these examples. This is a representative subset of cities named Newark, sufficient for demonstration purposes.
| COUNTRY | STATE / PROVINCE | CITY | LATITUDE | LONGITUDE |
|---|---|---|---|---|
| United Kingdom | Nottinghamshire | Newark | 53.076111 | -0.809167 |
| United Kingdom | Peterborough | Newark | 52.590833 | -0.209722 |
| United States | Arkansas | Newark | 35.701667 | -91.441389 |
| United States | California | Newark | 37.533333 | -122.033333 |
| United States | Delaware | Newark | 39.683611 | -75.749722 |
| United States | Illinois | Newark | 41.536389 | -88.580833 |
| United States | Indiana | Newark | 39.128889 | -86.807222 |
| United States | Maryland | Newark | 38.265278 | -75.271667 |
| United States | Missouri | Newark | 39.993333 | -91.973333 |
| United States | Nebraska | Newark | 40.641111 | -98.963056 |
| United States | New Jersey | Newark | 40.72422 | -74.172574 |
| United States | New York | Newark | 43.046667 | -77.095278 |
| United States | Ohio | Newark | 40.063056 | -82.416667 |
| United States | South Dakota | Newark | 45.929444 | -97.791389 |
| United States | Texas | Newark | 33.013611 | -97.488333 |
| United States | Vermont | Newark | 44.702222 | -71.942778 |
| United States | West Virginia | Newark | 39.118889 | -81.3975 |
| United States | Wisconsin | Newark | 42.534722 | -89.179722 |
Power BI Data Setup
After connecting Power BI to the underlying data source, the data columns are configured as follows.
Country
- From the
Datapane, selectCOUNTRY. - On the
Column toolstab, setData typetoText. - On the
Column toolstab, setFormattoText. - On the
Column toolstab, setSummarizationtoDon’t summarize. - On the
Column toolstab, setData categorytoCountry.
State / Province
- From the
Datapane, selectSTATE. - On the
Column toolstab, setData typetoText. - On the
Column toolstab, setFormattoText. - On the
Column toolstab, setSummarizationtoDon’t summarize. - On the
Column toolstab, setData categorytoState or Province.
City
- From the
Datapane, selectCITY. - On the
Column toolstab, setData typetoText. - On the
Column toolstab, setFormattoText. - On the
Column toolstab, setSummarizationtoDon’t summarize. - On the
Column toolstab, setData categorytoCity.
Latitude
- From the
Datapane, selectLATITUDE. - On the
Column toolstab, setData typetoDecimal number. - On the
Column toolstab, setFormattoGeneral. - On the
Column toolstab, setSummarizationtoDon’t summarize. - On the
Column toolstab, setData categorytoLatitude.
Longitude
- From the
Datapane, selectLONGITUDE. - On the
Column toolstab, setData typetoDecimal number. - On the
Column toolstab, setFormattoGeneral. - On the
Column toolstab, setSummarizationtoDon’t summarize. - On the
Column toolstab, setData categorytoLongitude.
Mapping Attempts
To demonstrate the complexity of city-level mapping in Power BI, a Map visualization is added to a report and several configurations are attempted and evaluated.
Attempt 1: Mapping Using City Name Only
Result: Rendered incorrectly
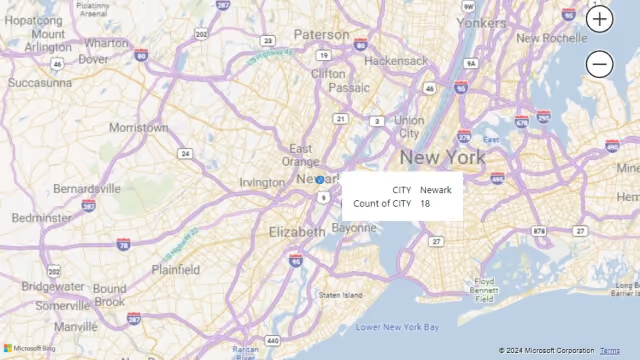
In the Location configuration field for the Map visualization, only the CITY data field is used. In the Bubble size configuration field for the Map, Count of CITY is used.
The Map is rendered with all 18 cities named Newark mapped to Newark, New Jersey. This is incorrect given the other data points already available in the source table. Since city name is the only information provided to the visualization, the mapping service resolves every record to the same Newark location. The selection appears to favor the most prominent or highest-ranked geographic match, although Microsoft’s ranking criteria are not documented.
Attempt 2: Mapping Using City Name, Latitude, and Longitude
Result: Rendered correctly
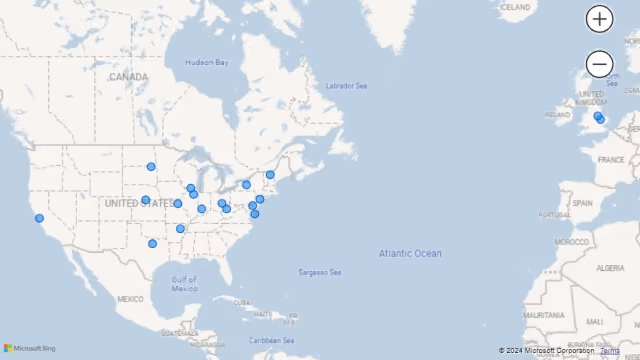
In this attempt, add the LATITUDE and LONGITUDE fields to the existing Map visualization configuration.
In the Latitude configuration field for the Map, the LATITUDE data field is added. In the Longitude configuration field for the Map, the LONGITUDE data field is added. The CITY data field is added to the Tooltips configuration field otherwise the tooltip only displays the latitude and longitude coordinates.
The Location and Bubble size configuration fields remain the same as in the first attempt.
The Map is rendered correctly at the city-level with the bubbles displayed at the expected locations.
Attempt 3: Mapping Using State/Province and City Name
Result: Rendered incorrectly
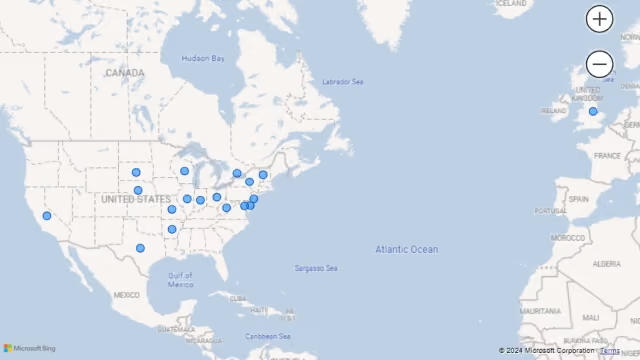
Changing the Map configuration to consider the state/province data in addition to the city name shows an improvement in the rendered Map as compared to the first attempt. However, the Map is still incorrect.
The LATITUDE and LONGITUDE data fields from the second attempt are removed.
In the Location configuration field for the Map visualization, the STATE data field is added above the CITY data field.
At first glance, the Map appears to be correct. However, upon further inspection, notice that only one location is identified in the United Kingdom instead of the two locations found in the data table. There is also a bubble incorrectly placed in Canada. This discrepancy is due to Newark, Peterborough, United Kingdom. By only supplying the values Peterborough (State/Province) and Newark (City), the mapping service assumes the value Peterborough is referring to a location in Ontario, Canada instead of the United Kingdom.
Also, the other bubbles are correctly identified even though their placement looks slightly off. One possible explanation is that the mapping service positions the bubble using the state/province rather than the exact city coordinates when latitude and longitude are unavailable.
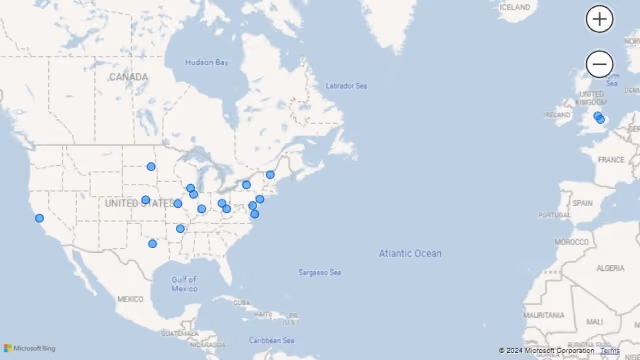
Expand to the city-level data by clicking the Expand all down one level in the hierarchy button. Do not use the Go to the next level in the hierarchy button as that will ignore the state/province information entirely and render the Map as if only city name was provided.
The expanded Map at the city-level is rendered correctly. The mapping service considers the state/province data as it evaluates the city names. The Newark, Peterborough data point is correctly rendered in the United Kingdom. All other data points are mapped correctly.
Attempt 4: Mapping Using Country, State/Province, and City Name
Result: Rendered correctly
Refine the third attempt by changing the Map visualization configuration to additionally consider the associated country with the state/province data and the city name.
In the Location configuration field for the Map, the COUNTRY data field is added above the STATE data field.
At the country-level, the Map is rendered correctly with 16 locations in the United States and two locations in the United Kingdom. No locations are identified in Canada.
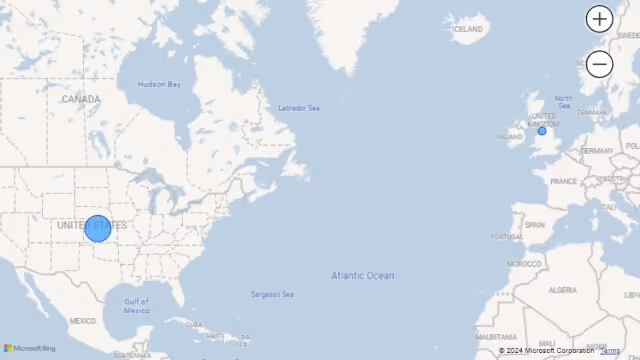
Expand to the state/province-level by clicking the Expand all down one level in the hierarchy button. Do not use the Go to the next level in the hierarchy button as that will ignore the country information entirely.
At the state/province-level, the Map is also rendered correctly. Unlike the prior example where country data was not used, both United Kingdom locations are mapped to the United Kingdom. The issue found with Newark, Peterborough does not occur when country information is provided in the hierarchy.
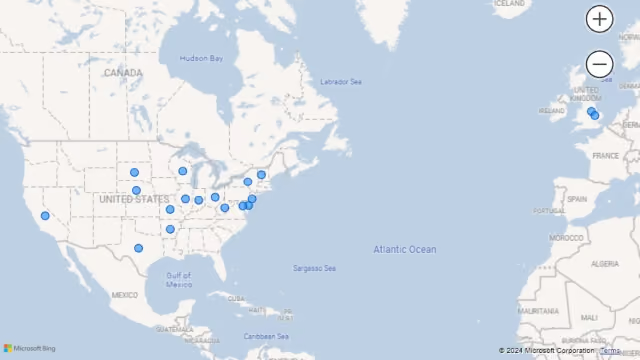
Expanding to the lowest level (city-level), the Map continues to be rendered as expected. No issues are identified with the mapped locations.
Attempt 5: Mapping Using a Country, State/Province, and City Hierarchy
Result: Rendered correctly
For completeness, this section demonstrates mapping using a defined hierarchy of the Country, State/Province, and City data columns.
Use the following steps to add the hierarchy to the model:
- From the
Datapane, click the ellipsis (three dots) next to theCOUNTRYfield. - Select
Create hierarchy. - A new hierarchy field named
COUNTRY Hierarchyis added to the model. - From the
Datapane, click the ellipsis (three dots) next to theSTATEfield. - Hover over
Add to hierarchyand selectCOUNTRY Hierarchy. - From the
Datapane, click the ellipsis (three dots) next to theCITYfield. - Hover over
Add to hierarchyand selectCOUNTRY Hierarchy. - From the
Datapane, click the ellipsis (three dots) next to theCOUNTRY Hierarchyfield. - Select
Rename. - Change the hierarchy name to
GEOGRAPHY Hierarchy.
In the Location configuration field, remove any existing data fields and add the new GEOGRAPHY Hierarchy data field instead.
At the country-level, the Map is rendered correctly with 16 locations in the United States and two locations in the United Kingdom. No locations are identified in Canada.
Expand to the state/province-level data by clicking the Expand all down one level in the hierarchy button. Do not use the Go to the next level in the hierarchy button as that will ignore the country-level information entirely.
At the state/province-level, the Map is rendered correctly. Both United Kingdom locations are mapped to the United Kingdom and the issue found with Newark, Peterborough does not occur when country information is provided in the hierarchy.
At the city-level, the Map is rendered correctly with 16 locations in the United States and two locations in the United Kingdom. No locations are identified in Canada.
Summary
Based on the attempts above, use the following as a quick guide:
- Precise coordinates available: Add
LatitudeandLongitudefields (Attempt 2). This is the most reliable option since it bypasses name-based geocoding entirely. - Only place names available: Build a
Country→State/Province→Cityhierarchy (Attempt 5) or add all three as separate location fields (Attempt 4). Either approach resolves ambiguity correctly at every drill-down level. - City name alone: Avoid this configuration (Attempt 1). It reliably maps to the wrong location whenever the city name is not unique.
Even with country, state/province, and city all provided, extremely small or newly renamed places can still fail to resolve correctly. Latitude and longitude remain the only fully reliable fallback in those cases.