Power BI Map Visualizations: Mapping Continents and Countries
Maps are everywhere, with instant access to detailed electronic maps available directly from phones, tablets, computers, and cars. Some people use old maps as wall art. For others, the large folded paper map found in a car door side pocket is still the preferred option when electronic maps are not available (though it should be updated periodically, since roads may have changed over the past 50 years).
From a technology standpoint, the coronavirus pandemic demonstrated the critically important need for digital mapping services. Maps relayed information about COVID-19 case levels, hospitalizations, deaths, and vaccine availability through a familiar and easy-to-use visualization. Vast amounts of data from all over the world were consolidated and made available at aggregate global and granular local levels through maps.
Adding Map visualizations to Power BI seems straightforward given their ubiquity. While adding the visualization is simple, getting the data to render correctly is more complicated. This is partly due to issues specific to Power BI, but the complexity also reflects how intricate the world is. Continents, regions, countries, and cities can have different names and political statuses. Disputed territories might be recognized differently depending on political perspectives and countries that span multiple continents can be difficult to categorize. This complexity is compounded at the city level, where non-unique names introduce a separate set of ambiguity problems, covered in Power BI Map Visualizations: Mapping Common City Names.
Mapping is inherently complex regardless of the platform used. Power BI, which relies on Bing/Azure for its mapping services, adds another layer of complexity. Bing/Azure might recognize locations differently than Google Maps or other mapping services in terms of naming, borders, and political status, since each provider maintains its own geographic database and political-recognition policies.
Successful geocoding does not necessarily imply successful shape rendering. In several cases, Power BI correctly identifies a location for a Map visualization while the corresponding Filled Map visualization renders incomplete or disputed boundaries.
The examples below illustrate some of these challenges with Power BI.
Enable Map Visualizations in Power BI
Power BI Map visualizations are not enabled by default due to security reasons. Map visuals send geographic data to Microsoft’s mapping service to render locations, so organizations should review their data-handling requirements before enabling them.
If the error Map and filled map visuals are disabled is displayed, enable the following security option to use the Map or Filled Map visualizations.
- From the Power BI application menu, click
File. - Click
Options and settings. - Click
Options. TheOptionswindow is displayed. - Within the
GLOBALsection, clickSecurity. - In the list of
Securityoptions, find theMap and Filled Map visualssection and enable theUse Map and Filled Map visualsoption. - Click the
OKbutton to close theOptionswindow.
Continents
Power BI’s mapping service recognizes the following seven continents.
NOTE: The terms Australia and Oceania are not interchangeable with respect to recognized continent names. As an example, the term Australia when used as a continent name in Power BI does not fill New Zealand on a Filled Map visualization. However, the term Oceania, when set to the
Data categoryofContinent, does fill New Zealand. Power BI’s mapping service recognizes both Australia and Oceania as continent values, but they produce different Filled Map results. In this context, Oceania represents a broader geographic grouping that includes New Zealand, while Australia does not.
Columns containing continent names should be set to the Continent data category.
- From the
Datapane, select the data field containing continent names. - On the
Column toolstab, setData categorytoContinent.
| CONTINENT |
|---|
| Africa |
| Antarctica |
| Asia |
| Australia |
| Europe |
| North America |
| South America |
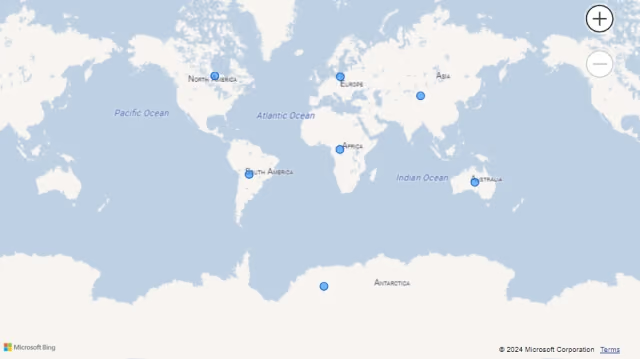
Map Visualization Using Continent Names
Using the listed continent names, a Map visualization places the bubbles at a central point in the expected locations.
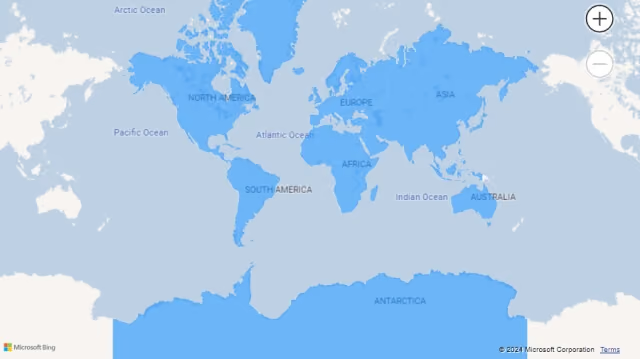
Filled Map Visualization Using Continent Names
Using a Filled Map visualization instead of a Map visualization produces some unexpected results. All of the continents are filled as expected. However, some island nations and territories are not filled when using continent names only. As an example, Cuba, Haiti, and Dominican Republic are filled as expected but Jamaica and Puerto Rico are not filled.
Countries
Mapping country data is both fascinating and problematic. A search for a reference list of valid country names for Power BI did not reveal a single, consistent source. There are many partially recognized countries, disputed territories, and varying names. Countries listed in one reference might not appear in another because they are not recognized by the organization maintaining the list. Even if a country is listed, Power BI might not recognize it in its built-in mapping service. Country names also vary, for example, the United States can appear as the United States, United States of America, U.S., U.S.A., or simply America.
This country list is neither official nor complete. It simply includes names and associated counts that were recognized by Power BI’s mapping service at the time the list was assembled. Mapping behavior may change over time as Microsoft updates its underlying geographic data. If a country is missing or incorrectly categorized, correct it in the report and retest the results.
Also included is a list of additional locations recognized by Power BI’s mapping service when the Data category is set to Country. Note that this is not a comprehensive list, so use it carefully. For example, Puerto Rico is listed as a country in Power BI but is actually a U.S. territory.
Columns containing country names should be set to the Country data category.
- From the
Datapane, select the data field containing country names. - On the
Column toolstab, setData categorytoCountry.
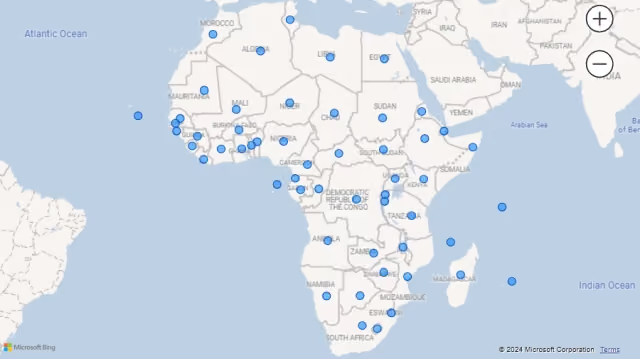
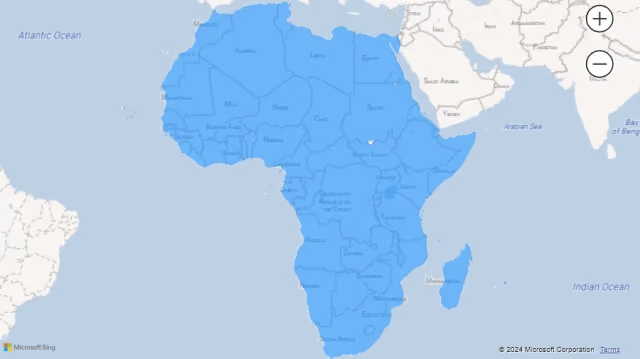
Africa
There are 54 countries mapped to Africa. The Map visualization is rendered as expected. However, the Filled Map visualization appears to have unfilled areas in Sudan and South Sudan along with a few surrounding islands and territories.
Asia
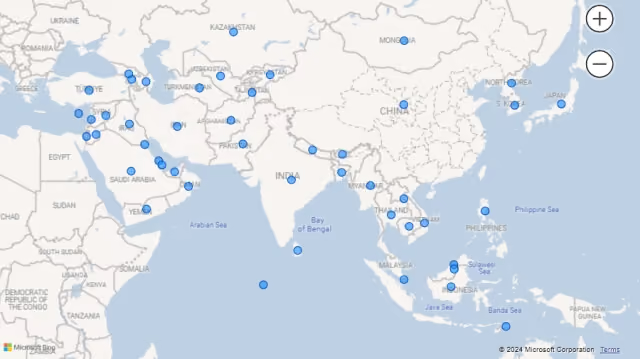
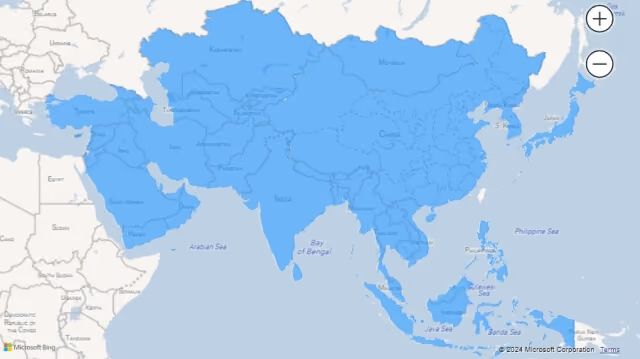
There are 47 countries mapped to Asia. The Map visualization is rendered as expected. However, the Filled Map visualization appears to have unfilled areas along the border of China with India, Kyrgyzstan, and Kazakhstan as well as unfilled surrounding islands and territories. There are also unfilled areas with respect to Israel and Palestine.
Australia
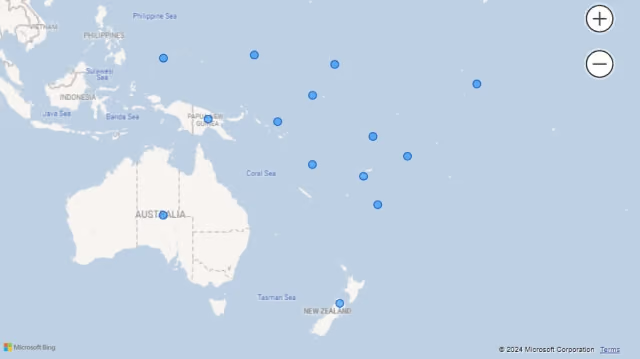
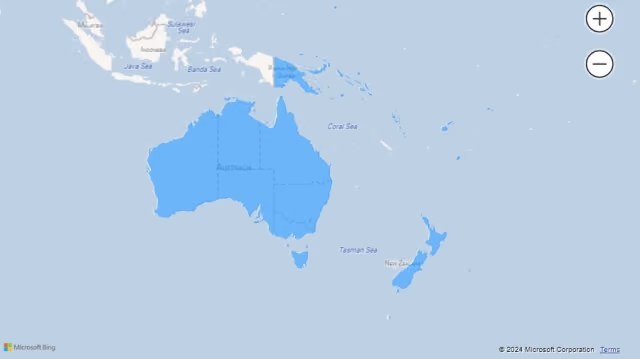
There are 14 countries mapped to Australia. Both the Map and Filled Map visualizations render as expected.
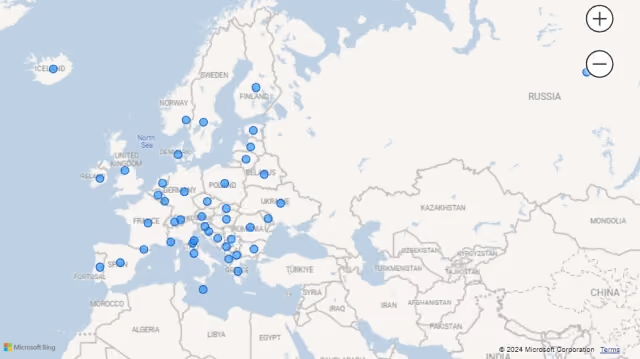
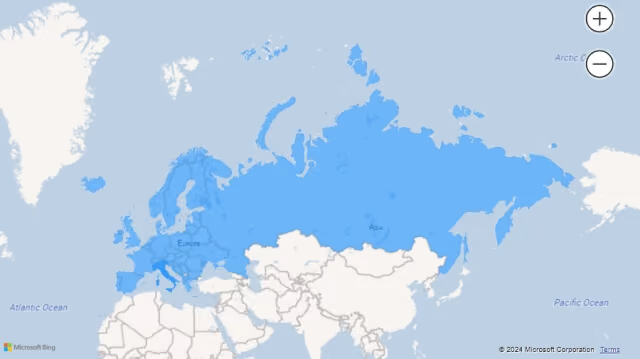
Europe
There are 44 countries mapped to Europe. The Map visualization is rendered as expected. However, the Filled Map visualization appears to double-count Italy as represented by a darker fill color. One possible explanation is that the mapping service treats Vatican City as a separate geographic entity, resulting in overlapping polygons or aggregation behavior.
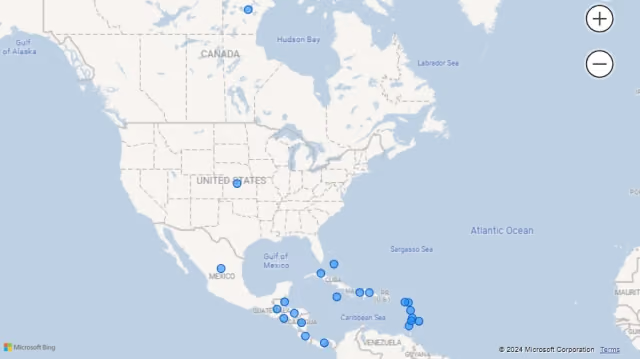
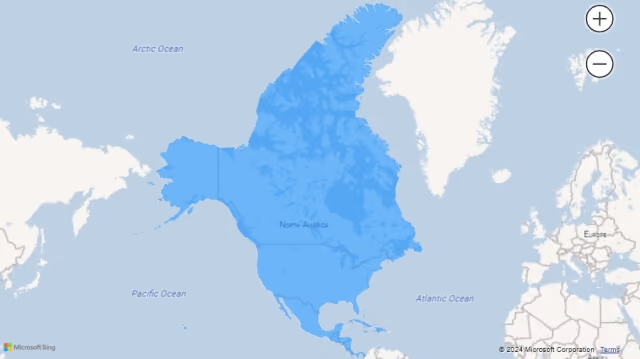
North America
There are 22 countries mapped to North America. Both the Map and Filled Map visualizations render as expected.
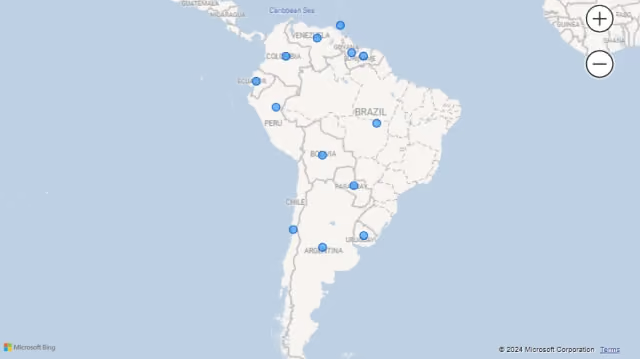
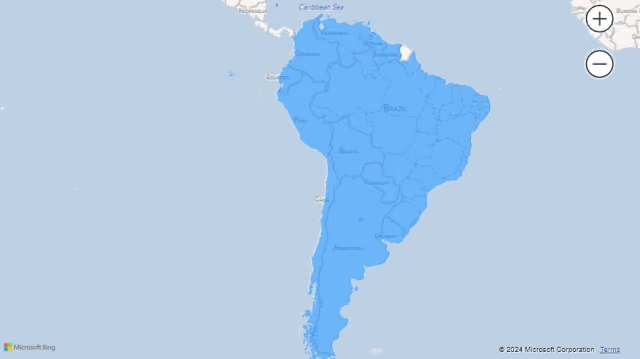
South America
There are 13 countries mapped to South America. Both the Map and Filled Map visualizations render as expected. French Guiana is listed in the other countries, territories, and lands section, so it remains unmarked and unfilled here.
Other Countries, Territories, and Lands
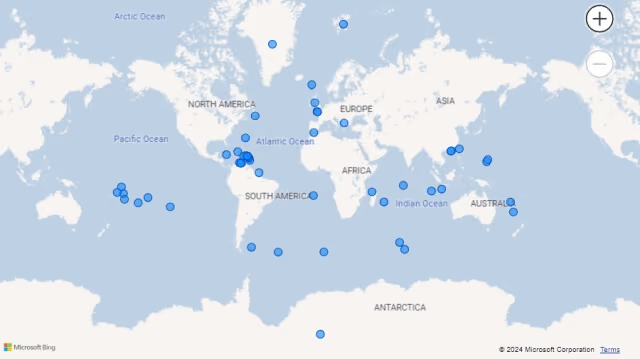
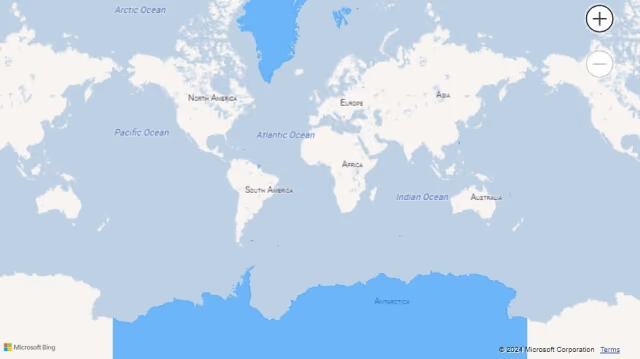
There are 51 additional countries, territories, islands, and lands recognized by Power BI’s mapping service and rendered in Map visualizations when the Data category is set to Country. Several entries in this category are commonly mistaken for sovereign countries, including Hong Kong and Macao (special administrative regions of China) and Taiwan (a self-governing territory with a disputed international status).
Combined Country List
NOTE: The country table below groups nations using the standard continent model for reference purposes. This grouping does not necessarily match Filled Map rendering behavior. See the Continent Names section above for the Australia/Oceania distinction.
| AFRICA | ASIA | AUSTRALIA | EUROPE | NORTH AMERICA | SOUTH AMERICA | OTHER |
|---|---|---|---|---|---|---|
| Algeria | Afghanistan | Australia | Albania | Antigua and Barbuda | Argentina | American Samoa |
| Angola | Armenia | Federated States of Micronesia | Andorra | Bahamas | Bolivia | Anguilla |
| Benin | Azerbaijan | Fiji | Austria | Barbados | Brazil | Antarctica |
| Botswana | Bahrain | Kiribati | Belarus | Belize | Chile | Aruba |
| Burkina Faso | Bangladesh | Marshall Islands | Belgium | Canada | Colombia | Bermuda |
| Burundi | Bhutan | Nauru | Bosnia and Herzegovina | Costa Rica | Ecuador | Bonaire |
| Cameroon | Brunei | New Zealand | Bulgaria | Cuba | Guyana | Bouvet Island |
| Cape Verde | Cambodia | Palau | Croatia | Dominica | Paraguay | British Indian Ocean Territory |
| Central African Republic | China | Papua New Guinea | Czechia | Dominican Republic | Peru | British Virgin Islands |
| Chad | Cyprus | Samoa | Denmark | El Salvador | Suriname | Cayman Islands |
| Comoros | Georgia | Solomon Islands | Estonia | Grenada | Trinidad and Tobago | Christmas Island |
| Côte d’Ivoire | India | Tonga | Finland | Guatemala | Uruguay | Cocos (Keeling) Islands |
| Democratic Republic of the Congo | Indonesia | Tuvalu | France | Haiti | Venezuela | Cook Islands |
| Djibouti | Iran | Vanuatu | Germany | Honduras | Curaçao | |
| Egypt | Iraq | Greece | Jamaica | Falkland Islands | ||
| Equatorial Guinea | Israel | Hungary | Mexico | Faroe Islands | ||
| Eritrea | Japan | Iceland | Nicaragua | French Guiana | ||
| Eswatini | Jordan | Ireland | Panama | French Polynesia | ||
| Ethiopia | Kazakhstan | Italy | Saint Kitts and Nevis | French Southern and Antarctic Lands | ||
| Gabon | Kuwait | Latvia | Saint Lucia | Gibraltar | ||
| Ghana | Kyrgyzstan | Liechtenstein | Saint Vincent and the Grenadines | Greenland | ||
| Guinea | Laos | Lithuania | United States | Guadeloupe | ||
| Guinea-Bissau | Lebanon | Luxembourg | Guam | |||
| Kenya | Malaysia | Malta | Guernsey | |||
| Lesotho | Maldives | Moldova | Heard Island and McDonald Islands | |||
| Liberia | Mongolia | Monaco | Hong Kong | |||
| Libya | Myanmar | Montenegro | Isle of Man | |||
| Madagascar | Nepal | Netherlands | Jersey | |||
| Malawi | North Korea | North Macedonia | Kosovo | |||
| Mali | Oman | Norway | Macao | |||
| Mauritania | Pakistan | Poland | Martinique | |||
| Mauritius | Philippines | Portugal | Mayotte | |||
| Morocco | Qatar | Romania | Montserrat | |||
| Mozambique | Saudi Arabia | Russia | New Caledonia | |||
| Namibia | Singapore | San Marino | Niue | |||
| Niger | South Korea | Serbia | Norfolk Island | |||
| Nigeria | Sri Lanka | Slovakia | Northern Mariana Islands | |||
| Republic of the Congo | Syria | Slovenia | Pitcairn Islands | |||
| Rwanda | Tajikistan | Spain | Puerto Rico | |||
| São Tomé and Príncipe | Thailand | Sweden | Réunion | |||
| Senegal | Timor-Leste | Switzerland | Saint Barthelemy | |||
| Seychelles | Turkey | Ukraine | Saint Helena, Ascension and Tristan Da Cunha | |||
| Sierra Leone | Turkmenistan | United Kingdom | Saint Martin | |||
| Somalia | United Arab Emirates | Vatican City | Saint Pierre and Miquelon | |||
| South Africa | Uzbekistan | Sint Maarten | ||||
| South Sudan | Vietnam | South Georgia and South Sandwich Islands | ||||
| Sudan | Yemen | Svalbard | ||||
| Tanzania | Taiwan | |||||
| The Gambia | Tokelau | |||||
| Togo | Turks and Caicos | |||||
| Tunisia | Wallis and Futuna | |||||
| Uganda | ||||||
| Zambia | ||||||
| Zimbabwe |
Known Rendering Quirks
| Region | Issue | Possible Cause |
|---|---|---|
| Oceania | New Zealand not filled when using Australia as continent name. | Power BI treats Australia and Oceania as distinct continent categories. |
| Caribbean | Jamaica and Puerto Rico not filled on Filled Map (continent-level). | Island nations/territories inconsistently included in continent boundary data. |
| Africa | Sudan and South Sudan unfilled areas. | Disputed or recently changed border data. |
| Asia | Unfilled areas along China’s borders with India, Kyrgyzstan, and Kazakhstan; Israel/Palestine. | Disputed territory boundaries. |
| Europe | Italy double-counted (darker fill). | Vatican City may be treated as a separate geographic entity by the mapping service. |
Summary
Integrating Map visualizations into Power BI can be challenging because geographic names, borders, territories, and recognition policies vary across mapping providers. Adding a Map visual is straightforward. Ensuring that locations resolve and render consistently requires standardized geographic data, appropriate data categories, and validation of the results in the target visualization. The examples in this article illustrate several cases where Power BI’s mapping service recognizes a location name, but the corresponding Filled Map output differs from the expected geographic boundary.