Build a Power BI Timeline Visual With Deneb and Vega
Power BI includes many built-in visualizations, but a multi-project milestone timeline is not one of them. Deneb fills that gap by using the Vega and Vega-Lite visualization grammars to create custom visuals directly in Power BI.
This article builds the timeline in two stages: first as a self-contained Vega specification with sample data, and then with data from Power BI.
Scenario Overview
A project portfolio contains several projects, each with a series of milestones. The timeline gives each project a horizontal lane, with lollipop-style markers positioned by date. Each marker has a label with the milestone name and date, and a tooltip provides additional detail.
Data Setup
Deneb is added to the Power BI report as a custom visual. After creating a Deneb visual, Vega is selected as the visualization language. This example was built with Deneb 2.0.0 using Vega 6.
The initial example uses sample data embedded directly in the Vega specification. This keeps the example self-contained and allows the specification to be tested in the Vega Editor or before connecting it to a Power BI dataset.
The sample data contains three fields:
ProjectName: The project containing the milestone.MilestoneName: The name of the milestone.MilestoneDate: The date of the milestone.
For example:
Website Redesign | Kickoff         | 2026-10-01
Website Redesign | Wireframes      | 2026-10-28
Website Redesign | Design Complete | 2026-11-30
Website Redesign | Beta Launch     | 2027-01-12
Website Redesign | Go Live         | 2027-02-15
The other projects follow the same structure.
The complete Vega specification appears in the Source Code section at the end of this article. It can be pasted into the Deneb editor with the included sample data.
Create the Vega Specification
The specification starts by declaring Vega 6:
"$schema": "https://vega.github.io/schema/vega/v6.json"It also describes the purpose of the visual:
"description": "Multi-project milestone swimlane timeline."It then defines signals, data sources, scales, axes, and marks.
Signals
The signals section contains values used throughout the specification.
The lane height is controlled by:
{ "name": "laneHeight", "value": 100 },laneHeight is used to calculate the overall height of the visual:
"autosize": { "type": "fit-x" },
"height": { "signal": "length(data('projects')) * laneHeight" },
This means the Vega canvas becomes taller as the number of projects increases. The Power BI visual keeps its own size, so a report with many projects may need a larger visual to show every lane.
The autosize setting fits the chart width to the Power BI visual, including the axis labels.
Other signals control the position of the timeline and milestone markers:
{ "name": "baselinePosition", "value": 0.9 },
{ "name": "headPosition", "value": 0.5 }
Additional signals define colors, line widths, marker sizes, font sizes, label offsets, and date formats.
For example:
{ "name": "timelineColor", "value": "#666666" },
{ "name": "timelineWidth", "value": 3 },
{ "name": "headColor", "value": "#4c78a8" },
{ "name": "headSize", "value": 120 }
Keeping these values in signals makes the visual easier to customize without changing the underlying mark definitions.
Data Sources
The sample records are defined in the dataset data source:
{
  "name": "dataset",
  "format": { "type": "json", "parse": { "MilestoneDate": "date" } },
  "values": [
    ...
  ]
}
Date-only strings such as 2026-10-01 parse as midnight UTC, so the specification uses UTC functions for its scales, calculations, and formatting. With these sample strings, local-time functions would display some milestones one day early in timezones behind UTC.
The source data contains one record for every milestone. The visual also needs one record for every project so that it can draw the project timeline.
A second dataset called projects is created from dataset:
{
  "name": "projects",
  "source": "dataset",
  "transform": [
    {
      "type": "aggregate",
      "groupby": ["ProjectName"],
      "fields": ["MilestoneDate", "MilestoneDate"],
      "ops": ["min", "max"],
      "as": ["EarliestDate", "LatestDate"]
    }
  ]
}
The aggregate transform groups the records by ProjectName and calculates the minimum and maximum MilestoneDate.
The two datasets have different purposes:
datasetcontains individual milestones.projectscontains one record for each project.
Date Range
The x-axis needs a date range that encompasses all of the milestones. Three signals calculate it from dataset.
The specification first calculates the overall extent (rawExtent) of MilestoneDate:
{
  "name": "rawExtent",
  "update": "extent(pluck(data('dataset'), 'MilestoneDate'))"
}
The earliest (earliestDataDate) and latest (latestDataDate) dates are then moved to the first day of the previous month and the first day of the following month:
{
  "name": "earliestDataDate",
  "update": "utc(utcyear(rawExtent[0]), utcmonth(rawExtent[0]) - 1, 1)"
},
{
  "name": "latestDataDate",
  "update": "utc(utcyear(rawExtent[1]), utcmonth(rawExtent[1]) + 1, 1)"
}
The additional space prevents the first and last milestones from appearing directly against the edges of the chart.
Scales
The x scale converts milestone dates into horizontal positions:
{
  "name": "x",
  "type": "utc",
  "domain": [
    { "signal": "earliestDataDate" },
    { "signal": "latestDataDate" }
  ],
  "range": "width"
}
The utc scale keeps the date calculations consistent with the UTC handling elsewhere in the specification.
The y scale is a band scale based on the project names:
{
  "name": "y",
  "type": "band",
  "domain": {
    "data": "projects",
    "field": "ProjectName"
  },
  "range": "height",
  "padding": 0
}
Axes
The bottom axis represents time:
{
  "orient": "bottom",
  "scale": "x",
  "domain": true,
  "format": { "signal": "axisDateFormat" },
  "tickCount": "month"
}
The axisDateFormat signal is set to:
{ "name": "axisDateFormat", "value": "%b %Y" }The axis therefore displays labels such as Oct 2026, Nov 2026, and Dec 2026.
The left axis uses the project names. Its domain line and ticks are hidden because the project labels provide the required identification for each lane.
Marks
Project Lanes
The first mark creates the alternating lane backgrounds:
{
  "name": "lanes",
  "type": "rect",
  "from": { "data": "projects" }
}
Each rectangle occupies the full width of the chart and one y-band.
The two lane colors are defined by:
{ "name": "laneColors", "value": ["#ffffff", "#eeeeee"] }The fill expression selects between those colors based on the project’s position in the y-axis domain:
"laneColors[indexof(domain('y'), datum.ProjectName) % length(laneColors)]"Project Timelines
The timeline mark uses a rule for each project:
{
  "name": "timeline",
  "type": "rule",
  "from": { "data": "projects" }
}
The rule begins at EarliestDate and ends at LatestDate:
"x": { "scale": "x", "field": "EarliestDate" },
"x2": { "scale": "x", "field": "LatestDate" }
Its vertical position is calculated from the project’s y-band and the baselinePosition signal.
Milestone Stems
The individual milestone records are used to create vertical stems:
{
  "name": "stems",
  "type": "rule",
  "from": { "data": "dataset" }
}
The x-position is determined by MilestoneDate.
The stem begins at the project timeline and extends upward to the milestone marker. This connects each milestone to its project’s timeline while making its position on the date axis clear.
Milestone Markers
The milestone heads are symbol marks:
{
  "name": "heads",
  "type": "symbol",
  "from": { "data": "dataset" }
}
Each marker uses the milestone date for its x-position, and the project’s y-band and the headPosition signal for its vertical position.
The appearance is controlled by signals such as:
{ "name": "headSize", "value": 120 },
{ "name": "headColor", "value": "#4c78a8" },
{ "name": "headOutlineColor", "value": "#ffffff" }
The markers also contain a tooltip:
"tooltip": {
  "signal": "{'Project': datum.ProjectName, 'Milestone': datum.MilestoneName, 'Date': utcFormat(datum.MilestoneDate, tooltipDateFormat)}"
}
The tooltip displays the project, milestone, and formatted date when a milestone is hovered.
Milestone Labels
The final mark is a text mark for each milestone:
{
  "name": "labels",
  "type": "text",
  "from": { "data": "dataset" }
}
The label uses the same x-position as the milestone marker.
Its text is generated from the milestone name and formatted date:
"text": {
  "signal": "[datum.MilestoneName, utcFormat(datum.MilestoneDate, labelDateFormat)]"
}
Because the expression supplies two strings, Vega renders the milestone name and date on separate lines.
For example:
Design Complete
Nov 30
The labelOffset signal moves the text above the marker.
The specification does not adjust labels that would overlap. Milestones placed close together in the same lane may need a smaller labelFontSize or a wider visual.
Connect the Visual to Power BI
- Add the Deneb visual to the report.
- Select
Vegaas the visualization language. - Add
ProjectName,MilestoneName, andMilestoneDatetoValues.
Deneb exposes each data field to Vega by the name shown in the Values field well, so the names must match the specification. If the model columns use different names, rename the fields in the Values field well or update the references.
- Add the Vega specification.
- Replace the embedded values and the
format.parseentry with thedatasetdefinition shown below.
{
  "name": "dataset"
}
The format.parse entry applies only to the embedded sample strings. With Power BI data, keeping it causes Deneb to log a warning.
The rest of the specification continues to reference dataset. The projects dataset is unchanged because it is derived from dataset within Vega:
{
  "name": "projects",
  "source": "dataset",
  "transform": [
    {
      "type": "aggregate",
      "groupby": ["ProjectName"],
      "fields": ["MilestoneDate", "MilestoneDate"],
      "ops": ["min", "max"],
      "as": ["EarliestDate", "LatestDate"]
    }
  ]
}
NOTE: In this example, Power BI supplied each date as a timestamp such as
2027-03-15T04:00:00.000Z, which is midnight in Eastern daylight time expressed in UTC. The UTC-based calculations return the correct calendar day when the timestamps are generated in a timezone at or behind UTC. If they are generated in a timezone ahead of UTC, local midnight falls on the previous UTC day, so some milestones could display one day early. If the visual must work across timezones, adjust the date handling accordingly.
- Apply the specification.
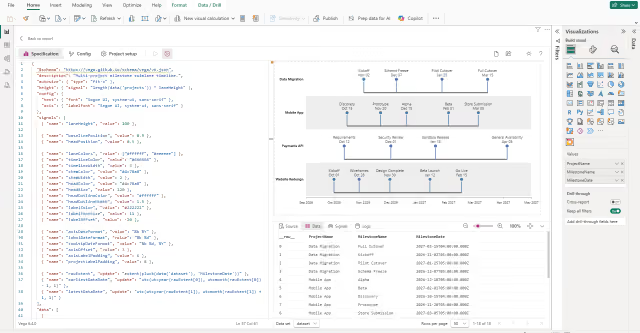
Results
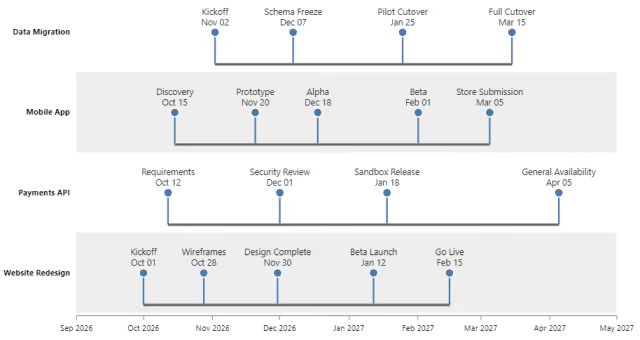
The completed visual displays each project in its own horizontal swimlane, with milestone markers positioned along a shared date axis. Project names identify the lanes, while each milestone displays its name and date.
The result should have the following characteristics:
- Each project has its own horizontal lane.
- The x-axis provides a common timeline for comparing projects.
- Milestone markers appear at their corresponding dates.
- Milestone labels identify the event and its date.
- Adding or removing projects changes the number of lanes without requiring changes to the Vega specification.
Source Code
{
  "$schema": "https://vega.github.io/schema/vega/v6.json",
  "description": "Multi-project milestone swimlane timeline.",
  "autosize": { "type": "fit-x" },
  "height": { "signal": "length(data('projects')) * laneHeight" },
  "config": {
    "text": { "font": "Segoe UI, system-ui, sans-serif" },
    "axis": { "labelFont": "Segoe UI, system-ui, sans-serif" }
  },
  "signals": [
    { "name": "laneHeight", "value": 100 },

    { "name": "baselinePosition", "value": 0.9 },
    { "name": "headPosition", "value": 0.5 },

    { "name": "laneColors", "value": ["#ffffff", "#eeeeee"] },
    { "name": "timelineColor", "value": "#666666" },
    { "name": "timelineWidth", "value": 3 },
    { "name": "stemColor", "value": "#4c78a8" },
    { "name": "stemWidth", "value": 2 },
    { "name": "headColor", "value": "#4c78a8" },
    { "name": "headSize", "value": 120 },
    { "name": "headOutlineColor", "value": "#ffffff" },
    { "name": "headOutlineWidth", "value": 1.5 },
    { "name": "labelColor", "value": "#222222" },
    { "name": "labelFontSize", "value": 11 },
    { "name": "labelOffset", "value": -20 },

    { "name": "axisDateFormat", "value": "%b %Y" },
    { "name": "labelDateFormat", "value": "%b %d" },
    { "name": "tooltipDateFormat", "value": "%b %d, %Y" },
    { "name": "axisOffset", "value": 3 },
    { "name": "axisLabelPadding", "value": 6 },
    { "name": "projectLabelPadding", "value": 8 },

    { "name": "rawExtent", "update": "extent(pluck(data('dataset'), 'MilestoneDate'))" },
    { "name": "earliestDataDate", "update": "utc(utcyear(rawExtent[0]), utcmonth(rawExtent[0]) - 1, 1)" },
    { "name": "latestDataDate", "update": "utc(utcyear(rawExtent[1]), utcmonth(rawExtent[1]) + 1, 1)" }
  ],
  "data": [
    {
      "name": "dataset",
      "format": { "type": "json", "parse": { "MilestoneDate": "date" } },
      "values": [
        { "ProjectName": "Website Redesign", "MilestoneName": "Kickoff", "MilestoneDate": "2026-10-01" },
        { "ProjectName": "Website Redesign", "MilestoneName": "Wireframes", "MilestoneDate": "2026-10-28" },
        { "ProjectName": "Website Redesign", "MilestoneName": "Design Complete", "MilestoneDate": "2026-11-30" },
        { "ProjectName": "Website Redesign", "MilestoneName": "Beta Launch", "MilestoneDate": "2027-01-12" },
        { "ProjectName": "Website Redesign", "MilestoneName": "Go Live", "MilestoneDate": "2027-02-15" },

        { "ProjectName": "Mobile App", "MilestoneName": "Discovery", "MilestoneDate": "2026-10-15" },
        { "ProjectName": "Mobile App", "MilestoneName": "Prototype", "MilestoneDate": "2026-11-20" },
        { "ProjectName": "Mobile App", "MilestoneName": "Alpha", "MilestoneDate": "2026-12-18" },
        { "ProjectName": "Mobile App", "MilestoneName": "Beta", "MilestoneDate": "2027-02-01" },
        { "ProjectName": "Mobile App", "MilestoneName": "Store Submission", "MilestoneDate": "2027-03-05" },

        { "ProjectName": "Data Migration", "MilestoneName": "Kickoff", "MilestoneDate": "2026-11-02" },
        { "ProjectName": "Data Migration", "MilestoneName": "Schema Freeze", "MilestoneDate": "2026-12-07" },
        { "ProjectName": "Data Migration", "MilestoneName": "Pilot Cutover", "MilestoneDate": "2027-01-25" },
        { "ProjectName": "Data Migration", "MilestoneName": "Full Cutover", "MilestoneDate": "2027-03-15" },

        { "ProjectName": "Payments API", "MilestoneName": "Requirements", "MilestoneDate": "2026-10-12" },
        { "ProjectName": "Payments API", "MilestoneName": "Security Review", "MilestoneDate": "2026-12-01" },
        { "ProjectName": "Payments API", "MilestoneName": "Sandbox Release", "MilestoneDate": "2027-01-18" },
        { "ProjectName": "Payments API", "MilestoneName": "General Availability", "MilestoneDate": "2027-04-05" }
      ]
    },
    {
      "name": "projects",
      "source": "dataset",
      "transform": [
        {
          "type": "aggregate",
          "groupby": ["ProjectName"],
          "fields": ["MilestoneDate", "MilestoneDate"],
          "ops": ["min", "max"],
          "as": ["EarliestDate", "LatestDate"]
        }
      ]
    }
  ],
  "scales": [
    {
      "name": "x",
      "type": "utc",
      "domain": [{ "signal": "earliestDataDate" }, { "signal": "latestDataDate" }],
      "range": "width"
    },
    {
      "name": "y",
      "type": "band",
      "domain": { "data": "projects", "field": "ProjectName" },
      "range": "height",
      "padding": 0
    }
  ],
  "axes": [
    {
      "orient": "bottom",
      "scale": "x",
      "domain": true,
      "offset": { "signal": "axisOffset" },
      "format": { "signal": "axisDateFormat" },
      "labelPadding": { "signal": "axisLabelPadding" },
      "tickCount": "month"
    },
    {
      "orient": "left",
      "scale": "y",
      "domain": false,
      "ticks": false,
      "labelPadding": { "signal": "projectLabelPadding" },
      "labelFontWeight": "bold"
    }
  ],
  "marks": [
    {
      "name": "lanes",
      "type": "rect",
      "from": { "data": "projects" },
      "encode": {
        "update": {
          "x": { "value": 0 },
          "x2": { "signal": "width" },
          "y": { "scale": "y", "field": "ProjectName" },
          "height": { "scale": "y", "band": 1 },
          "fill": { "signal": "laneColors[indexof(domain('y'), datum.ProjectName) % length(laneColors)]" }
        }
      }
    },
    {
      "name": "timeline",
      "type": "rule",
      "from": { "data": "projects" },
      "encode": {
        "update": {
          "x": { "scale": "x", "field": "EarliestDate" },
          "x2": { "scale": "x", "field": "LatestDate" },
          "y": { "signal": "scale('y', datum.ProjectName) + bandwidth('y') * baselinePosition" },
          "stroke": { "signal": "timelineColor" },
          "strokeWidth": { "signal": "timelineWidth" }
        }
      }
    },
    {
      "name": "stems",
      "type": "rule",
      "from": { "data": "dataset" },
      "encode": {
        "update": {
          "x": { "scale": "x", "field": "MilestoneDate" },
          "y": { "signal": "scale('y', datum.ProjectName) + bandwidth('y') * baselinePosition" },
          "y2": { "signal": "scale('y', datum.ProjectName) + bandwidth('y') * headPosition" },
          "stroke": { "signal": "stemColor" },
          "strokeWidth": { "signal": "stemWidth" }
        }
      }
    },
    {
      "name": "heads",
      "type": "symbol",
      "from": { "data": "dataset" },
      "encode": {
        "update": {
          "x": { "scale": "x", "field": "MilestoneDate" },
          "y": { "signal": "scale('y', datum.ProjectName) + bandwidth('y') * headPosition" },
          "size": { "signal": "headSize" },
          "fill": { "signal": "headColor" },
          "stroke": { "signal": "headOutlineColor" },
          "strokeWidth": { "signal": "headOutlineWidth" },
          "tooltip": {
            "signal": "{'Project': datum.ProjectName, 'Milestone': datum.MilestoneName, 'Date': utcFormat(datum.MilestoneDate, tooltipDateFormat)}"
          }
        }
      }
    },
    {
      "name": "labels",
      "type": "text",
      "from": { "data": "dataset" },
      "encode": {
        "update": {
          "x": { "scale": "x", "field": "MilestoneDate" },
          "y": { "signal": "scale('y', datum.ProjectName) + bandwidth('y') * headPosition" },
          "dy": { "signal": "labelOffset" },
          "align": { "value": "center" },
          "baseline": { "value": "bottom" },
          "fontSize": { "signal": "labelFontSize" },
          "fill": { "signal": "labelColor" },
          "text": {
            "signal": "[datum.MilestoneName, utcFormat(datum.MilestoneDate, labelDateFormat)]"
          }
        }
      }
    }
  ]
}
Summary
Deneb and Vega make it possible to build visuals that Power BI does not provide. The milestone timeline shows how a custom visual can be constructed from relatively simple Vega building blocks by combining rectangles, rules, symbols, text, scales, and calculated values. Because the appearance is driven by signals, the same specification can be adapted to different data.