Create and Use Custom Date Tables in Power BI for Date Hierarchies
By default, when Auto date/time is enabled, Power BI automatically creates hidden date tables and default date hierarchies. While this default hierarchy works in many cases, it can lead to unexpected results in some visualizations. Custom date tables in Power BI provide more control over date hierarchies, allowing customization of the behavior, calculations, and formatting of date dimensions.
Instructions
Step 1: Create Date Table Using Power Query
In this example, Power Query is used to generate the date table, though it can also be created using a DAX expression in Power BI.
Power Query suits scenarios where the date table needs custom columns, such as fiscal periods or holiday flags, since the logic is easier to extend. For a simple contiguous date range with no custom columns, CALENDAR() or CALENDARAUTO() in DAX accomplishes the same result with less setup, at the cost of being harder to extend later.
- From the
Hometab, clickGet Dataand selectBlank Query. - The Power Query Editor will open a new blank query.
- In the Power Query Editor, click
Advanced Editoron theHometab, then add the following code. - Adjust the
StartDateandEndDatevariables to match the date range needed for the report. - Click
Doneto close the Advanced Editor. - After returning to the Power Query Editor, rename the table in the
Query Settingspane underPROPERTIES. In this example, it is namedTBL_PQ_DATE_TABLE.
let
  StartDate = #date(2025, 1, 1),
  EndDate = #date(2025, 12, 31),
  DateList = List.Dates(
    StartDate,
    Number.From(EndDate) - Number.From(StartDate) + 1,
    #duration(1, 0, 0, 0)
  ),
  #"Converted to Table" = Table.FromList(
    DateList,
    Splitter.SplitByNothing(),
    null,
    null,
    ExtraValues.Error
  ),
  #"Renamed Columns" = Table.RenameColumns(#"Converted to Table", {{"Column1", "DATE"}}),
  #"Add Column YEAR" = Table.AddColumn(#"Renamed Columns", "YEAR", each Date.Year([DATE])),
  #"Add Column QUARTER" = Table.AddColumn(
    #"Add Column YEAR",
    "QUARTER",
    each Date.QuarterOfYear([DATE])
  ),
  #"Add Column MONTH" = Table.AddColumn(#"Add Column QUARTER", "MONTH", each Date.Month([DATE])),
  #"Add Column DAY" = Table.AddColumn(#"Add Column MONTH", "DAY", each Date.Day([DATE])),
  #"Add Column QUARTER_LABEL" = Table.AddColumn(
    #"Add Column DAY",
    "QUARTER_LABEL",
    each "Q" & Number.ToText([QUARTER])
  ),
  #"Add Column MONTH_LABEL" = Table.AddColumn(
    #"Add Column QUARTER_LABEL",
    "MONTH_LABEL",
    each Date.ToText([DATE], "MMM")
  ),
  #"Add Column DAY_LABEL" = Table.AddColumn(
    #"Add Column MONTH_LABEL",
    "DAY_LABEL",
    each Date.ToText([DATE], "ddd")
  ),
  #"Add Column DAY_OF_WEEK" = Table.AddColumn(
    #"Add Column DAY_LABEL",
    "DAY_OF_WEEK",
    each Date.DayOfWeek([DATE])
  ),
  #"Add Column YEAR_QUARTER_LABEL" = Table.AddColumn(
    #"Add Column DAY_OF_WEEK",
    "YEAR_QUARTER_LABEL",
    each Number.ToText([YEAR]) & " " & [QUARTER_LABEL]
  ),
  #"Add Column YEAR_MONTH_LABEL" = Table.AddColumn(
    #"Add Column YEAR_QUARTER_LABEL",
    "YEAR_MONTH_LABEL",
    each Number.ToText([YEAR]) & " " & [MONTH_LABEL]
  ),
  #"Add Column SORT_YEAR_QUARTER" = Table.AddColumn(
    #"Add Column YEAR_MONTH_LABEL",
    "SORT_YEAR_QUARTER",
    each Number.ToText([YEAR]) & Text.PadStart(Number.ToText([QUARTER]), 2, "0")
  ),
  #"Add Column SORT_YEAR_QUARTER_MONTH" = Table.AddColumn(
    #"Add Column SORT_YEAR_QUARTER",
    "SORT_YEAR_QUARTER_MONTH",
    each [SORT_YEAR_QUARTER] & Text.PadStart(Number.ToText([MONTH]), 2, "0")
  ),
  #"Add Column SORT_YEAR_QUARTER_MONTH_DAY" = Table.AddColumn(
    #"Add Column SORT_YEAR_QUARTER_MONTH",
    "SORT_YEAR_QUARTER_MONTH_DAY",
    each [SORT_YEAR_QUARTER_MONTH] & Text.PadStart(Number.ToText([DAY]), 2, "0")
  ),
  #"Changed Type" = Table.TransformColumnTypes(
    #"Add Column SORT_YEAR_QUARTER_MONTH_DAY",
    {
      {"DATE", type date},
      {"YEAR", Int64.Type},
      {"QUARTER", Int64.Type},
      {"MONTH", Int64.Type},
      {"DAY", Int64.Type},
      {"QUARTER_LABEL", type text},
      {"MONTH_LABEL", type text},
      {"DAY_LABEL", type text},
      {"YEAR_QUARTER_LABEL", type text},
      {"YEAR_MONTH_LABEL", type text},
      {"SORT_YEAR_QUARTER", Int64.Type},
      {"SORT_YEAR_QUARTER_MONTH", Int64.Type},
      {"SORT_YEAR_QUARTER_MONTH_DAY", Int64.Type}
    }
  )
in
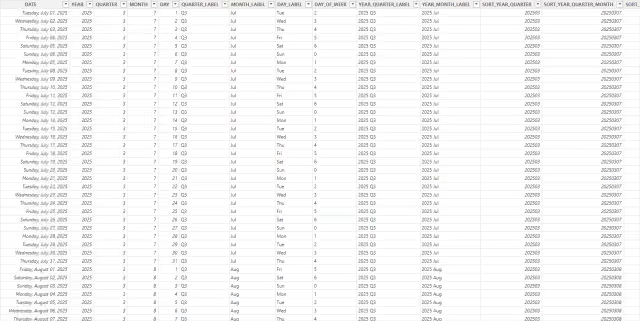
#"Changed Type"- The resulting table appears as follows with one entry for each day in the specified date range. Add or modify columns as needed. As an example, a new column may be needed to calculate fiscal quarters that may not align to standard calendar quarters (for example, fiscal Q1 may be October, November, and December instead of January, February, and March).
- From the
Hometab in the Power Query Editor, clickClose & Applyto return to Power BI Desktop.
Optional: Add a Fiscal Quarter Column
If fiscal quarters do not align to calendar quarters, insert a fiscal offset step into the script from Step 1, immediately before the closing in line, and update that line to reference the new step. The following example assumes a fiscal year beginning in October, where October through December are treated as fiscal Q1.
This replaces the final in #"Changed Type" line in the script above.
  #"Add Column FISCAL_QUARTER" = Table.AddColumn(
    #"Changed Type",
    "FISCAL_QUARTER",
    each Number.RoundUp(Number.Mod([MONTH] + 2, 12) / 3 + 0.01)
  )
in
  #"Add Column FISCAL_QUARTER"
Step 2: Date Table Adjustments
Returning to Power BI Desktop, the TBL_PQ_DATE_TABLE is now available in the Data pane.
If any fields in the TBL_PQ_DATE_TABLE are unexpectedly aggregated, set the summarization attribute to Don't summarize.
- In the
Datapane, click any field inTBL_PQ_DATE_TABLEcurrently set to summarize. - From the
Column toolstab setSummarizationtoDon't Summarize. - Repeat until all summarizations are removed.
Set the Sort by column attribute for each of the text-based fields. This informs Power BI how to correctly sort label columns in calendar order instead of alphabetically (for example, January, February, March).
- Click each label field and set the
Sort by columnas follows. - Repeat until all label fields are configured:
QUARTER_LABELsort by columnQUARTER.MONTH_LABELsort by columnMONTH.DAY_LABELsort by columnDAY_OF_WEEK.YEAR_QUARTER_LABELsort by columnSORT_YEAR_QUARTER.YEAR_MONTH_LABELsort by columnSORT_YEAR_QUARTER_MONTH.
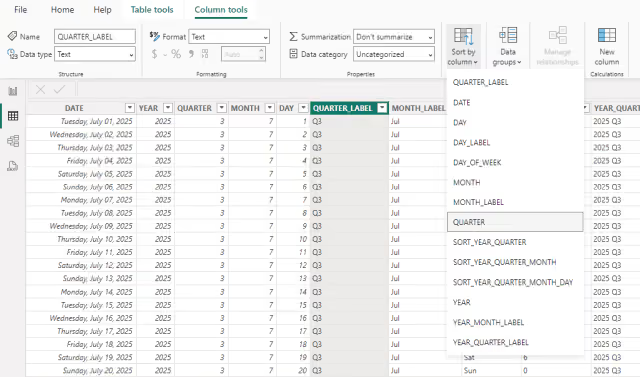
Next, create a year / quarter / month hierarchy.
- In the
Datapane, click theYEARfield inTBL_PQ_DATE_TABLE. - Click the ellipsis next to
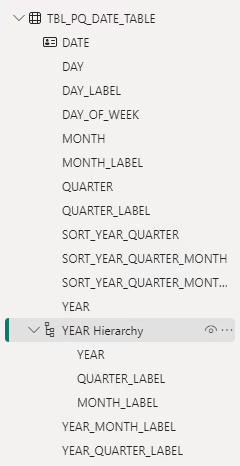
YEARand selectCreate hierarchy. - Power BI adds a
YEAR Hierarchyunder theTBL_PQ_DATE_TABLE. - Click the ellipsis next to
QUARTER_LABEL, selectAdd to hierarchy, and then chooseYEAR Hierarchy. - Click the ellipsis next to
MONTH_LABEL, selectAdd to hierarchy, and then chooseYEAR Hierarchy. - The completed hierarchy now contains
YEAR,QUARTER_LABEL, andMONTH_LABEL.
Step 3: Mark as Date Table
Now, inform Power BI to use the custom date table.
Marking the table as a date table tells Power BI to use it for time intelligence calculations and other date-aware operations instead of relying on automatically generated date tables.
- From the
Datapane, clickTBL_PQ_DATE_TABLE. - From the
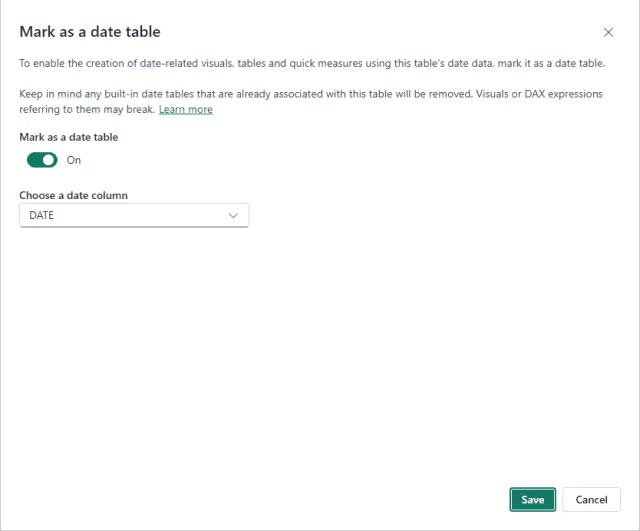
Table toolstab, clickMark as date table. - The
Mark as a date tabledialog box opens. - Enable
Mark as a date table. - Verify that the
DATEfield is selected in theChoose a date columndrop-down list. - Click the
Savebutton.
Step 4: Set Data Model Relationships
- Switch to the
Model view. - In this example, there is a simple data table called
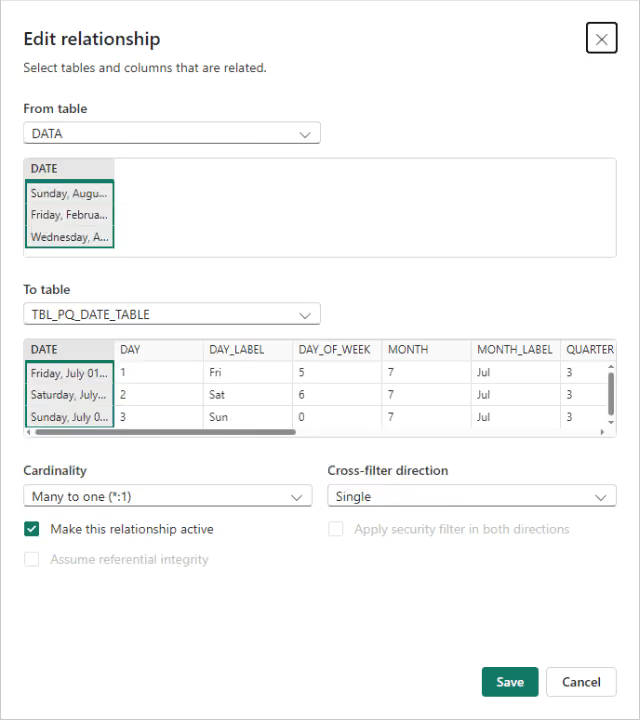
DATAwith a date column and a currency amount column. - Create a one-to-many relationship from
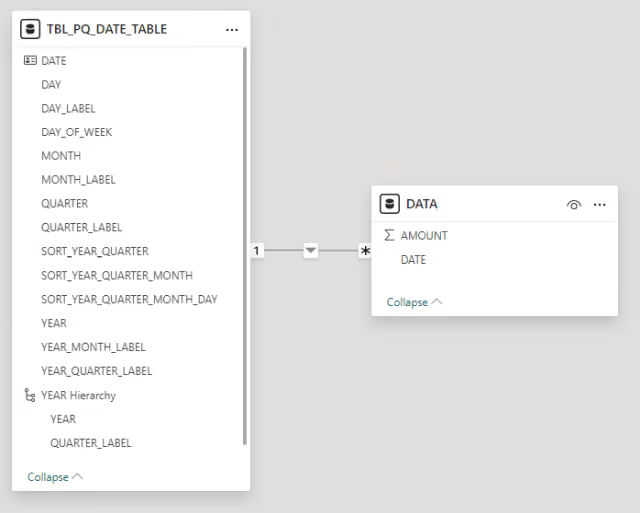
TBL_PQ_DATE_TABLE[DATE](one) toDATA[DATE](many), using the default single cross-filter direction. Because the date table contains one unique row for every calendar date, it can serve as the “one” side of the relationship.
Once the relationship is established, the data model appears as follows.
Results
- Switch to the
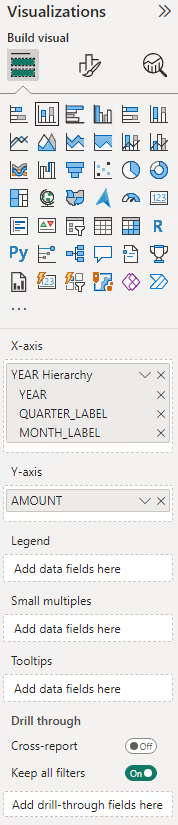
Report view. - To test the new date hierarchy, create a
Stacked column chartvisualization. - Set the
X-axisto theYEAR Hierarchyfrom the date tableTBL_PQ_DATE_TABLE. - Set the
Y-axistoAMOUNTfrom theDATAtable.
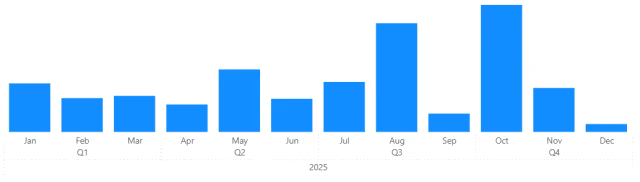
The visualization is created with the custom date hierarchy displayed correctly along the axis.
Summary
Creating a custom date table in Power BI gives full control over the date hierarchy, ensuring accurate and consistent results in visualizations. By following these steps, date dimensions can be tailored to the specific reporting requirements, improving the precision and flexibility of reports.