Power BI What-If Analysis: Create Interactive Reports Using Modeling Parameters
Microsoft Power BI enables users to model “what-if” scenarios and conduct sensitivity analyses using input parameters. This feature transforms Power BI from a tool for data retrieval, aggregation, transformation, and visualization into an interactive platform, allowing users to explore how decisions might affect outcomes.
Instructions
Step 1: Data Setup
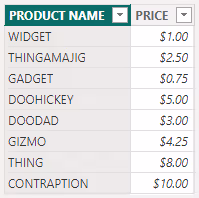
In this guide, we’ll use what-if analysis to assess how gross revenue changes based on units sold for products with varying prices. We have a simple table listing each product and its unit price, named TBL_PRODUCTS. This example table was created manually in Power BI.
For this demonstration, we’ll use two products: WIDGET and GADGET.
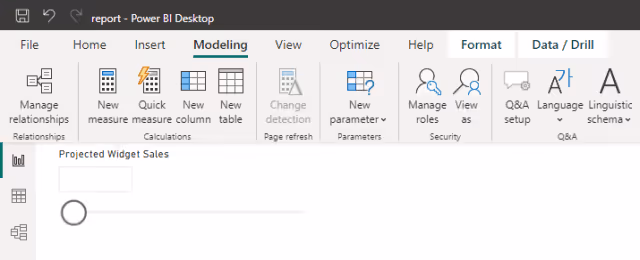
Step 2: Create Modeling Parameters
- From the
Modelingribbon in Power BI, clickNew parameter, and selectNumeric range.
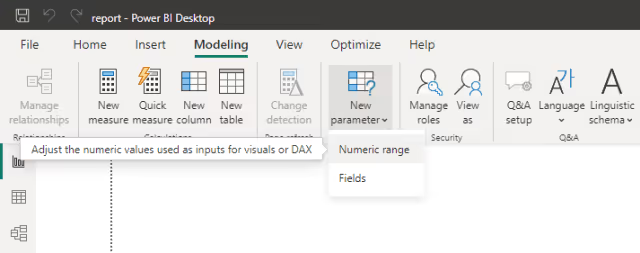
- The
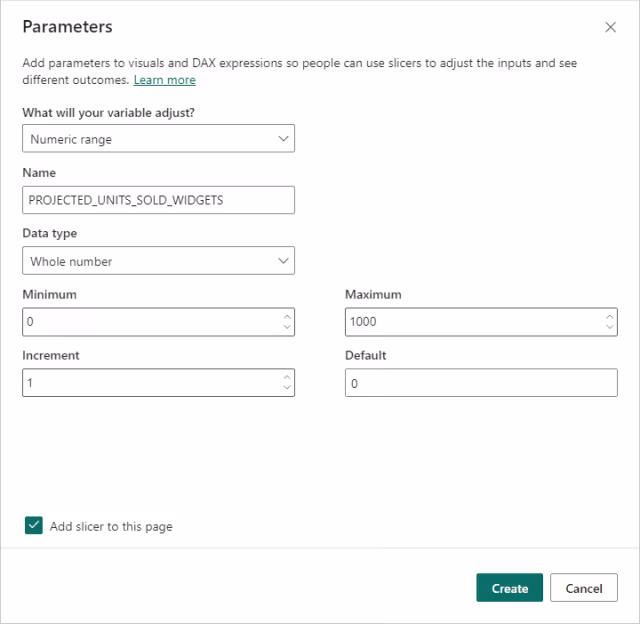
Parametersscreen is displayed. - Configure the new parameter as follows:
- Set the
What will your variable adjust?drop-down toNumeric range. - Set the
Namefield toPROJECTED_UNITS_SOLD_WIDGETS. - Set the
Data typedrop-down toWhole number. - Set the
Minimumfield to0. - Set the
Maximumfield to1000. - Set the
Incrementfield to1. - Set the
Defaultfield to0. - Enable the
Add slicer to this pagecheckbox.
- Set the
- Click the
Createbutton. - Repeat these steps to add a second parameter named
PROJECTED_UNITS_SOLD_GADGETS.
PROJECTED_UNITS_SOLD_WIDGETSStep 3: Format Slicers
Since Add slicer to this page was enabled, slicers will automatically appear in the Report view. By default, their titles match the parameter names, but let’s make them more user-friendly:
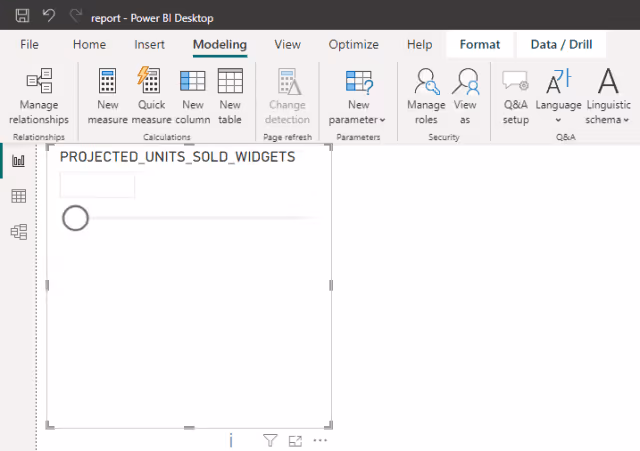
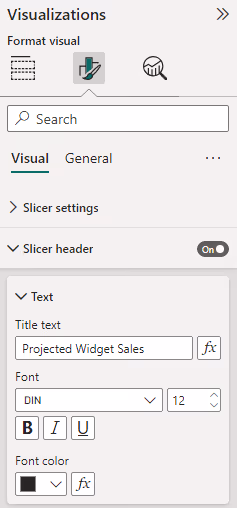
PROJECTED_UNITS_SOLD_WIDGETS Slicer Automatically Displayed- Select the
PROJECTED_UNITS_SOLD_WIDGETSslicer. - Open the
Visualizationspane and selectFormat visual. - Under the
Slicer headersection, update theTitle texttoProjected Widget Sales. - Repeat these steps for the
PROJECTED_UNITS_SOLD_GADGETSslicer, renaming the title toProjected Gadget Sales.
- Adjust the slicer’s height and width to fit the report layout.
Step 4: Create Calculations Using Parameters
To calculate gross revenue, create two new measures:
- From the
Data pane, selectPROJECTED_UNITS_SOLD_WIDGETS. - From the
Table toolsribbon, clickNew measure. - Enter the following DAX formula expression to calculate widget sales revenue:
MSR_PROJECTED_WIDGET_SALES =
  VAR vWidget_Price =
    CALCULATE (
      MAX ( TBL_PRODUCTS[PRICE] ),
      FILTER ( ALLSELECTED ( TBL_PRODUCTS ), TBL_PRODUCTS[PRODUCT NAME] = "WIDGET" )
    )
  VAR vProjected_Units_Sold_Widgets =
    SELECTEDVALUE ( PROJECTED_UNITS_SOLD_WIDGETS[PROJECTED_UNITS_SOLD_WIDGETS] )
RETURN vProjected_Units_Sold_Widgets * vWidget_Price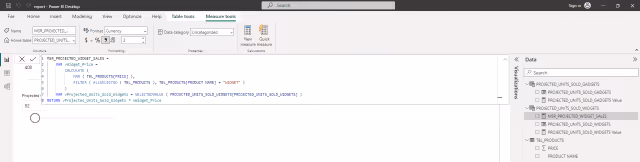
MSR_PROJECTED_WIDGET_SALES- Repeat these steps for
PROJECTED_UNITS_SOLD_GADGETSusing this DAX formula expression:
MSR_PROJECTED_GADGET_SALES =
  VAR vGadget_Price =
    CALCULATE (
      MAX ( TBL_PRODUCTS[PRICE] ),
      FILTER ( ALLSELECTED ( TBL_PRODUCTS ), TBL_PRODUCTS[PRODUCT NAME] = "GADGET" )
    )
  VAR vProjected_Units_Sold_Gadgets =
    SELECTEDVALUE ( PROJECTED_UNITS_SOLD_GADGETS[PROJECTED_UNITS_SOLD_GADGETS] )
RETURN vProjected_Units_Sold_Gadgets * vGadget_Price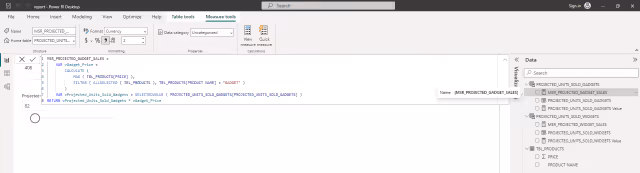
MSR_PROJECTED_GADGET_SALESStep 5: Add Visualizations
- In the
Report view, add aDonut chartfrom theVisualizationspane. - Drag
MSR_PROJECTED_WIDGET_SALESandMSR_PROJECTED_GADGET_SALESinto theValuesfield.
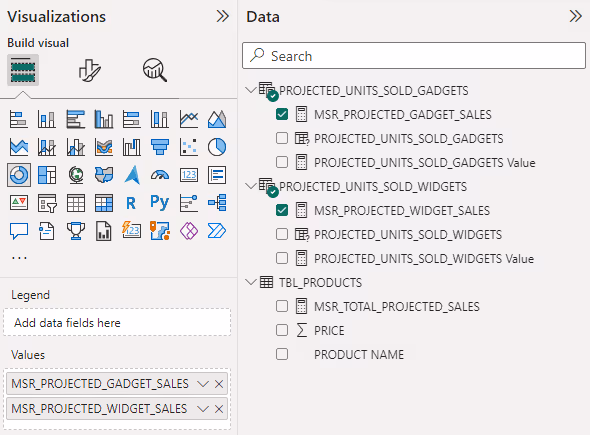
MSR_PROJECTED_WIDGET_SALES and MSR_PROJECTED_GADGET_SALES- To show total projected sales, create a new measure using the following DAX formula expression:
MSR_TOTAL_PROJECTED_SALES =
[MSR_PROJECTED_WIDGET_SALES] + [MSR_PROJECTED_GADGET_SALES]- Add a
Cardvisualization to displayMSR_TOTAL_PROJECTED_SALES.
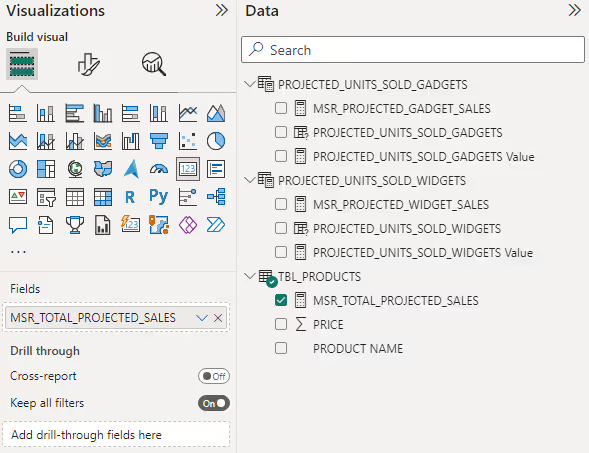
MSR_TOTAL_PROJECTED_SALESResults
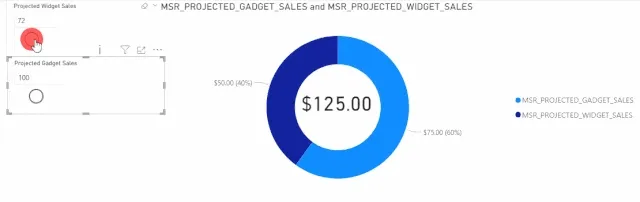
Your report will now show:
- Slicer for
Projected Widget Sales. - Slicer for
Projected Gadget Sales. - Donut chart displaying projected sales for widgets and gadgets.
- Card visualization showing total combined sales.
As users adjust slicer values, the report dynamically updates calculations and visualizations, enabling interactive what-if analysis. This transforms the user experience from passive report viewing to actively exploring data and outcomes.
Summary
By leveraging Power BI’s what-if analysis and modeling parameters, users can interactively explore how decisions affect outcomes. This dynamic approach turns static reports into powerful decision-making tools. As slicer values change, real-time visual updates provide immediate insights into projected sales and revenue.